Geschrieben 22. Juli 200916 Jr. comment_82921 Ich scheine mein Spielzeug für die nächsten Tage gefunden zu haben. Habe jetzt noch nicht Kontrolliert in wie weit die Signale so wirklich handel bar sind.Sollte aber eigentlich gehen da ich nach Signalgenerierung zum nächsten Open kaufe. Getestet auf den Russel 1000Start 01.01.20073% Kapital pro TradeBacktest jetzt mit Margin Konto 1 zu 2 Ich lasse jetzt erst mal die Zahlen auf mich einwirken bevor dann bei genauer Betrachtung das nicht machbare sichtbar wird Morgen folgen dann die Einzelheiten Melden
Geschrieben 24. Juli 200916 Jr. comment_83351 Das Hauptsächlich im Backtest Werte mit dem Kürzel mit A am Anfang gekauft werden liegt doch wahrscheinlich daran das AmiBroker immer die ersten Werte aus der Liste nimmt, wenn ich nicht irre.Genauso sieht's für mich aus. Der von DIR konfigurierte/programmierte Amibroker bevorzugt diese Werte, die als erstes in der Liste (alphabetisch sortiert nehm ich mal an, ist eigentlich Standard) auftauchen. Da DU aber den Amibroker beherrschen solltest und nicht umgekehrt, bist DU auch derjenige, der die Wert bevorzugt . Amibroker ist ja nur Dein verlängerter Arm, der in den großen Geldtopf mit der Mausefalle greift. Melden
Geschrieben 25. Juli 200916 Jr. Autor comment_83402 aus der Traum Mir gefiel ja von Anfang an irgend was an dieser Zeile DL = Ref( C, 25 ); // delayed close price, or chikou spannicht. Auch kam ich mit der Anzeige im Chart und den weiteren Berechnungen mit diesem Wert nicht klar.Habe es aber aus mangelnden Programmierkenntisen einfach so hin genommen. Nun hatten Gestern die 50% "meiner Fachleute" die leider noch nicht hier sind über den Code geschaut und das geschrieben.Klar, wie schaffst Du es denn, den Kurs in 25 Tagen heute schon zu wissen?Wenn ich den weiss, dann ist es wirklich einfach :-) DL = ... Also habe ich noch mal geschaut. Der Fehler in der heutigen Berechnung zur Trade Auswahl. Wenn man sich das Bild anschaut sieht man das der DL Wert gleich dem Close ist.(Den Close in 25 Tagen weiss leider selbst AmiBroker nicht) Von daher wundert es mich eigentlich das diese Zeile im Programm läuft?Buy = Cross(TL,SL) AND (DL>Close);Weil ja DL weder < noch > als Close sein kann sondern immer = Close ist. Der Fehler im Backtest. Im Backtest weiss Amibroker wenn er den weiter wie 25 Tage zurück geht ja nun mal den Close in 25 Tagen und rechnet mit dem was da steht.Sieht dann als Ergebnis zwar gut aus,(genauso ist es ja beim Zig/Zag Indikator. Wenn das Signal wirklich steht sieht es gut aus, aber Real wird es halt oft noch ein stück verschoben)hilft mir aber nicht wirklich weiter. Da ich vom Programmieren keinen Ahnung habe glaube ich meiner obigen Aussage natürlich nicht und suche die Gegen Probe. Die Bedingung war ja, das der heutige Close > dem Close von vor 25 Tagen ist.(Wenn das conglom-o bitte noch mal bestätigen könnte, danke) Wenn ich das jetzt so schreibe das ich das auch verstehe sieht das so aus DL = REF ( C,-25) dann muss ich noch diese Zeile anpassen Buy = Cross(TL,SL) AND (DL<Close); Alte Zeile = Buy = Cross(TL,SL) AND (DL>Close); Ich muss nicht > sondern < schreiben da ja DL der Close von vor 25 Tagen ist Dann sollte es so aussehen._SECTION_BEGIN("IchimokuBrian20080624"); PosSizePercent = 2; SetPositionSize(PosSizePercent,spsPercentOfEquity); SL = ( HHV( H, 26 ) + LLV( L, 26) )/2;// standard, base, or kijun-sen line TL = ( HHV( H, 9 ) + LLV( L, 9 ) )/2;// turning, conversion, or tenkan-sen line DL = Ref( C, -25 ); // delayed close price, or chikou span Span1 = Ref( ( SL + TL )/2, -25 ); //Span1 and Span2 define the clouds Span2 = Ref( (HHV( H, 52) + LLV(L, 52))/2, -25); CStyle = ParamToggle("Showcandles?","N|Y");//Choose Candle or Line for Price plot hue = Param("Hue",140,0,255,1); sat = Param("Sat",100,0,255,1); bri = Param("bri",220,0,255,1); MaxGraph = 8; Refline = (Span1 + Span2)/2; Graph0 = Refline; Graph0Style = 16;//No line plotted, used as a reference line for arrows etc. if(Cstyle ) Plot(C,"Price",colorBlack,styleCandle); else Plot(Close,"Close",colorBlack,styleThick); Plot(SL,"SL",colorBlue,styleThick); Plot(TL,"TL",colorRed,styleThick); Plot(DL,"DL",colorYellow,styleThick); PlotOHLC(Span1,Span1,Span2,Span2,"Cloud",ColorHSB( Hue,sat,bri),styleCloud); above = IIf(TL>Span1 AND TL>Span2,1,0); within = IIf(TL>Span1 AND TL<Span2,1,0); below = IIf(TL<Span1 AND TL<Span2,1,0); Buy = Cross(TL,SL) AND (DL<Close); Sell= Cross(SL,TL) AND (DL>SL); Short = Cross(SL,TL) AND (DL<Close); Cover = Cross(TL,SL) AND (DL>SL); BuyLong = Cross(TL,SL) AND (DL>Close); StrongBuy = Buy AND above; MediumBuy = Buy AND within; WeakBuy = Buy AND below; StrongSell = Sell AND below; MediumSell = Sell AND within; WeakSell = Sell AND above; IIf( (StrongBuy),PlotShapes(shapeUpTriangle*StrongBuy,colorGreen),0); IIf( (MediumBuy),PlotShapes(shapeUpArrow*MediumBuy,colorGreen),0); IIf( (WeakBuy),PlotShapes(shapeHollowUpArrow*WeakBuy,colorIndigo),0); IIf( (StrongSell),PlotShapes(shapeDownTriangle*StrongSell,colorRed),0); IIf( (MediumSell),PlotShapes(shapeDownArrow*MediumSell,colorRed),0); IIf( (WeakSell),PlotShapes(shapeHollowDownArrow*WeakSelL,colorBrown),0); AddColumn( BuyLong, "BuyLong", 1 ); Filter = BuyLong; _SECTION_END(); An bei dann mal die Test mit den Auswertungen,Links mit dem Alten, Rechts mit dem Neuenund die Ernüchterung ist da.Es gibt halt nicht den heiligen Gral. Test seit Jahresanfang auf den Russel 1000 Melden
Geschrieben 25. Juli 200916 Jr. comment_83419 Bitte nicht wundern: die Offtopic-Postings (v.a. wenn mehrere hintereinander kommen) verschiebe ich rigoros nach , damit das Thema hier möglichst sauber bleibt. Melden
Geschrieben 25. Juli 200916 Jr. comment_83420 Mir gefiel ja von Anfang an irgend was an dieser Zeile DL = Ref( C, 25 ); // delayed close price, or chikou span nicht. Auch kam ich mit der Anzeige im Chart und den weiteren Berechnungen mit diesem Wert nicht klar.Gut. Hör auf Deinen Bauch. Wenn Sachen zu gut aussehen, dann stimmt da meistens was nicht. Ich hab im Übrigen auch schon solche System "entwickelt", die so ne nette Performance zeigten bis ich die Bugs im Code und in meiner Denke gefunden haben. Von daher bist Du in guter Gesellschaft. Wie schaut's denn aus, wenn Du die Shortseite einfach weglässt ?! In Deinen Tabellen sah es so aus für mich als ob die Dir vor allem die Probleme bereitet. Eventuell kannst Du da ja mal weiterforschen, damit noch bisschen mehr Gewinn/Trade bei den Longs rausspringt. Melden
Geschrieben 25. Juli 200916 Jr. comment_83434 [...]das der heutige Close > dem Close von vor 25 Tagen ist.(Wenn das conglom-o bitte noch mal bestätigen könnte, danke)[...]An bei dann mal die Test mit den Auswertungen,Links mit dem Alten, Rechts mit dem Neuenund die Ernüchterung ist da.Es gibt halt nicht den heiligen Gral.Eigentlich sind es 26 Perioden zurück, aber ob man dann im Amibroker 25 (weil er bspw. bei 0 anfängt zu zählen) eingeben muss, weiß ich nicht. Der Vorteil beim Metatrader liegt hier ganz einfach darin, dass er den Ichimoku mitliefert und man somit direkt auf die Elemente zugreifen kann. Der Ansatz, dass der jetzige Close (verschoben dargestellt durch Chikou Span) über dem vor 26 Perioden liegen muss, ist aber korrekt. Wenn Du es jetzt "richtig" programmiert hast, würde es sich ja mit meinen (leicht ernüchternden) Erkenntnissen decken... Melden
Geschrieben 25. Juli 200916 Jr. Autor comment_83481 Eigentlich sind es 26 Perioden zurück, aber ob man dann im Amibroker 25 (weil er bspw. bei 0 anfängt zu zählen) eingeben muss, weiß ich nicht. Der Ansatz, dass der jetzige Close (verschoben dargestellt durch Chikou Span) über dem vor 26 Perioden liegen muss, ist aber korrekt. Sollte also so aussehen und die Zählung richtig sein? Bearbeitet 25. Juli 200916 Jr. von Krümel Geändertes Bild eingefügt Melden
Geschrieben 25. Juli 200916 Jr. comment_83491 Es kann auch sein, dass Du mit 0 anfangen musst zu zählen. Lass Dir am besten einfach mal per Print-Befehl die Schlusskurse der Kerzen vor 25 und 26 Perioden anzeigen. Würde Dir da gerne weiterhelfen, besitze aber den Amibroker nicht. Anhand des Chartbilds erkennst Du dann, welche Zahl Du wählen musst. Korrekt ist, dass die Kerze relevant ist, die Du im Moment mit 26 markiert hast. Warum er bei Dir dann noch diese waagerechte Linie ans Ende des Chikou Span malt, ist mir schleierhaft. Die gehört da eigentlich nicht hin und könnte den Betrachter eher etwas verwirren, wenn er das Konzept verstehen will. Melden
Geschrieben 25. Juli 200916 Jr. Autor comment_83492 Warum er bei Dir dann noch diese waagerechte Linie ans Ende des Chikou Span malt, ist mir schleierhaft. Die gehört da eigentlich nicht hin und könnte den Betrachter eher etwas verwirren, wenn er das Konzept verstehen will. Du meinst von dem Bar vor 26 Tagen zum Aktuellen Kurs? Ich glaube das einfachste sollte sein wenn ich mir die Regeln mal genau anschaue und das Ding komplett selber schreibe. Melden
Geschrieben 25. Juli 200916 Jr. comment_83493 Ich glaube das einfachste sollte sein wenn ich mir die Regeln mal genau anschaue und das Ding komplett selber schreibe.Das halte ich für eine großartige Idee . Wenn Du Sachen total auseinander nimmst und selbst wiederzusammensetzt, scheint das auf den ersten Blick mehr Arbeit zu sein. Aber Du lernst viel mehr dabei und die Zeit sparst Du später locker wieder ein, wenn Du bspw. Fehler suchst. Melden
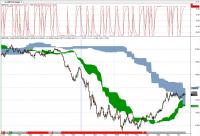
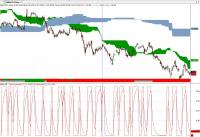
Geschrieben 25. Juli 200916 Jr. Autor comment_83501 scheint das auf den ersten Blick mehr Arbeit zu sein. Ist ja nicht meine Zeit,ich warte einfach bis Duncan wieder da ist Ich muss jetzt dann aber erst noch mal das grundsätzliche lesen.Wir hatten das ding eigentlich schon vor ein paar Monaten mal wo es im Trader stand. Da hatte es aber eigentlich 2 Wolken,eine Langfristige und eine kurze, wenn ich nicht irre, Sie wurden eigentlich auch etwas in die Zukunft gezeichnet. war wohl eine Wochen Wolke und ein mal die Tageskurs Wolke.Kann mich aber nicht mehr so genau dran erinnern.War die Sache wo es auch um den digital Stochastic nach Philip Kahler ging. Wir hatten es aber nie geschafft das die Wolken oder der Digi wirklich gleich aussah wie bei Kahler.Irgend wie immer etwas Verschiebung drin /* ICHIMOKU CHART FOR DAY / WEEK Screen*/ DSL=(HHV(H,26)+LLV(L,26))/2; DTL=(HHV(H,9)+LLV(L,9))/2; DSp1=((DSL+DTL)/2); DSp2=((HHV(H,52)+LLV(L,52))/2); TimeFrameSet( inWeekly); // switch to Weekly frame WSL=(HHV(H,26)+LLV(L,26))/2; WTL=(HHV(H,9)+LLV(L,9))/2; WSp1=((WSL+WTL)/2); WSp2=((HHV(H,52)+LLV(L,52))/2); TimeFrameRestore(); // restore time frame to original WSP1e = TimeFrameExpand( WSP1, inWeekly ); WSP2e = TimeFrameExpand( WSP2, inWeekly ); MP=(( O + C ) / 2); //Short_S1 = MP < WSp1e AND MP < WSp2e AND MP < DSP1 AND MP < DSP2; //LONG_S1 = MP > WSp1e AND MP > WSp2e AND MP > DSP1 AND MP > DSP2; Short_S1 = MP < Ref(WSp1e,-115) AND MP < Ref(WSp2e,-115) AND MP < Ref(DSP1,-25) AND MP < Ref(DSP2,-25); LONG_S1 = MP > Ref(WSp1e,-115) AND MP > Ref(WSp2e,-115) AND MP > Ref(DSP1,-25) AND MP > Ref(DSP2,-25); Color=IIf (LONG_S1,colorGreen,IIf(Short_S1,colorRed,Graph1Color = 0)); /* plot color ribbon */ Plot( 1, "", Color, styleArea | styleOwnScale | styleNoLabel, -0.1, 50 ); Plot(C,"Price",Color,styleBar); PlotOHLC (WSp1e,WSp1e,WSp2e,WSp2e,"Weekly",colorLightBlue,styleCloud,0,0,115); PlotOHLC (DSp1,DSp1,DSp2,DSp2,"Daily",colorGreen,styleCloud,0,0,25); Melden
Geschrieben 25. Juli 200916 Jr. comment_83504 Ja, es war eine Wochenwolke und eine Tageswolke, hab zufällig den Traders hier. Longtrend, wenn Tageswolke über Wochenwolke und Kurs über TageswolkeShort umgekehrt.Den Digitalstochastik hat er dann als Entry genommen, in Richtung des ermittelten Trend. Ich habe bei ihm den Code angefordert, dann kann ich das hoffentlich mal nachstellen. Melden
Geschrieben 25. Juli 200916 Jr. Autor comment_83505 Eigentlich sind es 26 Perioden zurück, aber ob man dann im Amibroker 25 (weil er bspw. bei 0 anfängt zu zählen) eingeben muss, weiß ich nicht. schon blöd wenn man keine Ahnung hat und langsam denkt Mal angenommen Amibroker fängt mit 0 an,dann wäre ja die 25 Richtig. Aber wie sieht es den dann hier bei aus? SL = ( HHV( H, 26 ) + LLV( L, 26) )/2;// standard, base, or kijun-sen line TL = ( HHV( H, 9 ) + LLV( L, 9 ) )/2;// turning, conversion, or tenkan-sen line Müsste ich dann nicht auch hier einen weniger zählen? Melden
Geschrieben 25. Juli 200916 Jr. Autor comment_83506 Ich habe bei ihm den Code angefordert, dann kann ich das hoffentlich mal nachstellen. Welchen?Für welches Programm? Den für den Digi haben wir hier http://www.tom-next.com/community/Stochast...5697#entry75697 Den für den ICHIMOKU müsste ich suchen,muss ihn aber meine ich auch haben.(Je nach Programm) Melden
Geschrieben 25. Juli 200916 Jr. comment_83511 @ibelieve OT - muss aber jetzt an der Stelle sein.Schau mal,Du zitierst conglom-o und setzt direkt darunter das Statement schon blöd wenn man keine Ahnung hat und langsam denkt Jetzt überlege mal, ich hätte den Satz direkt an eines Deiner Zitate angehängt.Was hättest Du in dem Moment gedacht ? Ehrlich! Melden
Geschrieben 25. Juli 200916 Jr. Autor comment_83514 Was hättest Du in dem Moment gedacht opps, dumm gelaufen, sorry. Ich hoffe man weiss beim 2 lesen das es auf mich bezogen ist. PS, kann man das bild in Posting 57 durch diese ersetzen? Melden
Geschrieben 25. Juli 200916 Jr. comment_83516 Welchen?Für welches Programm? Für TS5. Ichimoku ist bereits dabei,der Digitale Stochastik hat mir gefehlt, danke für den Link. Ich hoffe ich erhalte einen Arbeitsbereich, der dann so aussieht wie das Bild im Traders.... Kenne mich in Amibroker leider gar nicht aus.... Melden
Geschrieben 25. Juli 200916 Jr. Autor comment_83542 So, habe das ganze mal auf die Sachen Reduziert die ich verstehe. Schaut das jetzt so aus_SECTION_BEGIN("IchimokuBrianneu"); PosSizePercent = 3; SetPositionSize(PosSizePercent,spsPercentOfEquity); SL = ( HHV( H, 26 ) + LLV( L, 26) )/2;// standard, base, or kijun-sen line TL = ( HHV( H, 9 ) + LLV( L, 9 ) )/2;// turning, conversion, or tenkan-sen line DL = C; // delayed close price, or chikou span Span1 = Ref( ( SL + TL )/2, -25 ); //Span1 and Span2 define the clouds Span2 = Ref( (HHV( H, 52) + LLV(L, 52))/2, -25); hue = Param("Hue",140,0,255,1); sat = Param("Sat",100,0,255,1); bri = Param("bri",220,0,255,1); Plot(SL,"SL",colorBlue,styleThick); Plot(TL,"TL",colorRed,styleThick); Plot(DL,"DL",colorLime,styleThick,0,0,-25); PlotOHLC(Span1,Span1,Span2,Span2,"Cloud",ColorHSB( Hue,sat,bri),styleCloud); above = IIf(TL>Span1 AND TL>Span2,1,0); within = IIf(TL>Span1 AND TL<Span2,1,0); below = IIf(TL<Span1 AND TL<Span2,1,0); Buy = Cross(TL,SL) AND (C > Ref(Close,-25)); Sell= Cross(SL,TL) AND (DL > SL); Short = Cross(SL,TL) AND (C < Ref(Close,-25)); Cover = Cross(TL,SL) AND (DL>SL); BuyLong = Cross(TL,SL) AND (C > Ref(Close,-25)); StrongBuy = Buy AND above; MediumBuy = Buy AND within; WeakBuy = Buy AND below; StrongSell = Sell AND below; MediumSell = Sell AND within; WeakSell = Sell AND above; IIf( (StrongBuy),PlotShapes(shapeUpTriangle*StrongBuy,colorGreen),0); IIf( (MediumBuy),PlotShapes(shapeUpArrow*MediumBuy,colorGreen),0); IIf( (WeakBuy),PlotShapes(shapeHollowUpArrow*WeakBuy,colorIndigo),0); IIf( (StrongSell),PlotShapes(shapeDownTriangle*StrongSell,colorRed),0); IIf( (MediumSell),PlotShapes(shapeDownArrow*MediumSell,colorRed),0); IIf( (WeakSell),PlotShapes(shapeHollowDownArrow*WeakSelL,colorBrown),0); AddColumn( BuyLong, "BuyLong", 1 ); Filter = BuyLong; _SECTION_END(); Ein Problem habe ich jetzt mit der Sell Bedingung. Sell= Cross(SL,TL) AND (DL > SL); delayed close price, or chikou span > standard, base, or kijun-sen line heist das der Close heute > der kijun-sen line vor 26 Tagen sein muss?Kann ich mir jetzt irgend wie nicht vorstellen. Wäre nett wenn mal irgend wer ein Aktuelles Bild mit dem Indi einstellen könnte so das ich mal das aussehen der Linien vergleichen könnte. Melden
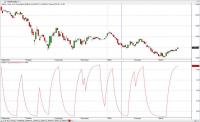
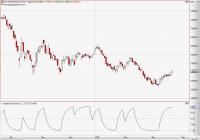
Geschrieben 26. Juli 200916 Jr. Autor comment_83584 Bei den meisten Beschreibungen die ich finde steht ja das,Ichimoku Kinko Hyo wurde in einer Zeit entwickelt, als eine Trading-Woche aus 6 Handelstagen bestand. Bedingt durch die heutige 5-tägige Handelswoche müssten die Perioden auf 7, 22, und 44 modifiziert werden. Von daher mal der angepasste Code.Wo bei ich noch doppelt testen werde um zu schauen was besser geht.Wenn man sich mal über die Regeln klar ist kann man dann auch mal den Optimizer drüber laufen lassen um zu schauen wie anfällig das System für veränderungen der Werte ist. _SECTION_BEGIN("IchimokuBriann7-22-44"); PosSizePercent = 10; SetPositionSize(PosSizePercent,spsPercentOfEquity); SL = ( HHV( H, 22 ) + LLV( L, 22) )/2;// standard, base, or kijun-sen line TL = ( HHV( H, 7 ) + LLV( L, 7 ) )/2;// turning, conversion, or tenkan-sen line DL = C; // delayed close price, or chikou span Span1 = ( SL + TL )/2; //Span1 and Span2 define the clouds Span2 = (HHV( H, 44) + LLV(L, 44))/2; hue = Param("Hue",140,0,255,1); sat = Param("Sat",100,0,255,1); bri = Param("bri",220,0,255,1); Plot(SL,"SL",colorBlue,styleThick); Plot(TL,"TL",colorRed,styleThick); Plot(DL,"DL",colorLime,styleThick,0,0,-21); PlotOHLC(Span1,Span1,Span2,Span2,"Cloud",ColorHSB( Hue,sat,bri),styleCloud,0,0,21); above = IIf(TL>Span1 AND TL>Span2,1,0); within = IIf(TL>Span1 AND TL<Span2,1,0); below = IIf(TL<Span1 AND TL<Span2,1,0); Buy = Cross(TL,SL) AND (C > Ref(Close,-21)); Sell= Cross(SL,TL) AND (DL > SL); Short = Cross(SL,TL) AND (C < Ref(Close,-21)); Cover = Cross(TL,SL) AND (DL>SL); BuyLong = Cross(TL,SL) AND (C > Ref(Close,-21)); StrongBuy = Buy AND above; MediumBuy = Buy AND within; WeakBuy = Buy AND below; StrongSell = Sell AND below; MediumSell = Sell AND within; WeakSell = Sell AND above; IIf( (StrongBuy),PlotShapes(shapeUpTriangle*StrongBuy,colorGreen),0); IIf( (MediumBuy),PlotShapes(shapeUpArrow*MediumBuy,colorGreen),0); IIf( (WeakBuy),PlotShapes(shapeHollowUpArrow*WeakBuy,colorIndigo),0); IIf( (StrongSell),PlotShapes(shapeDownTriangle*StrongSell,colorRed),0); IIf( (MediumSell),PlotShapes(shapeDownArrow*MediumSell,colorRed),0); IIf( (WeakSell),PlotShapes(shapeHollowDownArrow*WeakSelL,colorBrown),0); AddColumn( BuyLong, "BuyLong", 1 ); Filter = BuyLong; _SECTION_END(); Hier im Code möchte ich eine Stelle etwas genauer Erklären. Die Versetzung der Wolke wird im Ursprünglichen Code ja so erreicht,Span1 = Ref( ( SL + TL )/2, -25 ); //Span1 and Span2 define the clouds Span2 = Ref( (HHV( H, 52) + LLV(L, 52))/2, -25);über die REF wird die Anzeige vor 26 Tagen Heute angezeigt. Jetzt ist es aber ja hier so, das ich mir eigentlich die Wolke schon 26 Tage in der Zukunft anzeigen lasse.(Ist ja nichts magisches da es ja schon heute bekannt ist wie Sie in 26 Tagen aussieht) Dann sieht das ganze im Code so aus,Span1 = ( SL + TL )/2; //Span1 and Span2 define the clouds Span2 = (HHV( H, 52) + LLV(L, 52))/2; PlotOHLC(Span1,Span1,Span2,Span2,"Cloud",ColorHSB( Hue,sat,bri),styleCloud,0,0,25); Ich nehme das REF bei der Span Berechnung weg weil ich Sie vom heutigen Tag will,und versetze die Anzeige in der Plot Zeile durch die letzte Zahl um 26 Einheiten in die Zukunft. Zu den Glattstell Regeln ist mir noch nichts passendes eingefallen.Die aus dem Ursprünglichen Code sind ja eigentlich mit Vorsicht zu geniessen da Sie auf der Fehlerhaften Berechnung des DL(delayed close price, or chikou span) Wertes beruhen. Zu den Kaufbedingungen muss man sich wohl erst mal klar sein was man will. Laut Beschreibung sollte ein Long Signal über der Wolke sicherer sein als unter der Wolke.Bei den meisten Charts die ich mir jetzt angeschaut habe sieht es aber so aus,das wenn ich das Signal unter der Wolke nicht nahm,den größten Teil der Bewegung verpasste,und dann am Ende der Bewegung über der Wolke kaufte. Von daher muss man das alles dann in einem sehen,Trendhandel oder Ausbruch = Kaufpunkt = Stop Wie bei jedem Trendfolge System sind auch hier die größeren Seitwärtsbewegungen Tödlich. Als Bild ein Beispiel von vielen wo man sieht was man verpasst wenn man erst über der Wolke kauft. Melden
Geschrieben 26. Juli 200916 Jr. comment_83592 Wie bei jedem Trendfolge System sind auch hier die größeren Seitwärtsbewegungen Tödlich.Nicht ganz - wie bei jedem anderen Handelsstil ist auch hier nicht der Einstieg sondern der Ausstieg entscheidend (ist so ein Punkt, auf den wir in unserern Sendungen tagtäglich erneut hinweisen müssen). Dann endet das auch nicht tödlich. Melden
Geschrieben 26. Juli 200916 Jr. comment_83659 Ist ja nicht meine Zeit,ich warte einfach bis Duncan wieder da ist Ha ha ... war wohl eine Wochen Wolke und ein mal die Tageskurs Wolke. jup.Kann mich aber nicht mehr so genau dran erinnern.War die Sache wo es auch um den digital Stochastic nach Philip Kahler ging. Wir hatten es aber nie geschafft das die Wolken oder der Digi wirklich gleich aussah wie bei Kahler.Irgend wie immer etwas Verschiebung drinalte Mail aus dem Archiv:Hi,das ist der gleiche Artikel, so dass Du den aus dem Traders nicht mehr brauchst … nimm einfach mal den Code von Kahler (erste Mail) und packe den in TradeSignal dann siehst Du den Unterschied. Ich hoffe es ist erkennbar was ich meine … hast Du eine Idee dazu? Wenn die Entrys besser werden würden dann wäre es für mich perfekt … TradeSignal -> Code von KahlerAmiBroker -> mein alter Code //digital Stochastic nach Philip Kahler periods = Param( "Periods", 5, 1, 200, 1 ); KAdjust = Param( "%K avg", 3, 1, 200, 1 ); DAdjust= Param( "%D avg", 3, 1, 200, 1 ); KAdjusted = StochK(periods,KAdjust); DAdjusted = StochD(periods,KAdjust,DAdjust); CON=((22*KAdjusted)+(8*DAdjusted))/30; summ=IIf(CON > 50,1,-1); Plot( Summ, _DEFAULT_NAME(), ParamColor( "Color", colorCycle ), ParamStyle("Style") ); Plot( EMA(Summ,periods), _DEFAULT_NAME(), ParamColor( "Color", colorCycle ), ParamStyle("Style") ); _SECTION_BEGIN("ATR"); periods = Param( "Periods", 15, 1, 200, 1 ); InsideDay = H < Ref(High,-1) AND Low > Ref(Low,-1); Plot(IIf(InsideDay AND LLV(ATR(6),6),ATR(periods),0), _DEFAULT_NAME(), ParamColor( "Color", colorCycle ), ParamStyle("Style") ); _SECTION_END(); Antwort:hab hier was gefunden,http://www.intalus.de/de/produkte/tradesig...ert-trading.php kann es sein das der orginal länger auf der 1 bleibt?bei amibroker kommt er doch so gut wie nie auf 1.und er hat schwankungen die er bestimmt nicht machen soll.den rest schaue ich mir morgen an, mach jetzt schluss. Das ist so ziemlich unser alter Stand, mal sehen, ob ich das alte System auch noch finde ...Gruß Duncan Melden
Geschrieben 26. Juli 200916 Jr. comment_83663 Von daher mal der angepasste Code.Wo bei ich noch doppelt testen werde um zu schauen was besser geht.Wenn man sich mal über die Regeln klar ist kann man dann auch mal den Optimizer drüber laufen lassen um zu schauen wie anfällig das System für veränderungen der Werte ist.Hi,schau Dir das mal an: Amibroker Lib ist interessant wie dort DL definiert ist. Vielleicht sollten wir an dieser Stelle mal eine entsprechend Frage platzieren.Gruß DuncanPS: Und noch ein Code zum spielen ... /* ICHIMOKU CHART A bullish signal is issued when the Tenkan-Sen (RED line) crosses the Kijun-Sen (BLUE line) from below. On the other hand, a bearish signal is issued when the Tenkan-Sen crosses the Kijun-Sen from above. Moreover, there are, in fact, different levels of strength for the buy and sell signals of an Ichimoku chart. First, if there was a bullish crossover signal and the crossover occurred above the Kumo (or WHITE clouds), this would be considered a very strong buy signal (indicated with three green up arrows). In contrast, if there was a bearish crossover signal and the crossover occurred below the Kumo, this would be considered a very strong sell signal (indicated with three red down arrows, as above). Secondly, a normal buy or sell signal would be issued if the crossover took place within the Kumo (or clouds). These signals would be indicated with two green up arrows, for a buy signal, and two red down arrows, for a sell signal. Thirdly, a weak buy signal would be issued if there was a bullish crossover that occurred below the Kumo (or clouds). This is indicated with only one green up arrow (as above). On the other hand, a weak sell signal would be issued if there was a bearish crossover that occurred above the Kumo. This is indicated with only one red down arrow. Another striking feature of the Ichimoku charting technique is the identification of support and resistance levels. These levels can be predicted by the presence of Kumo (or WHITE clouds). The Kumo can also be used to help identify the prevailing trend of the market. If the BLACK price line is above the Kumo, the prevailing trend is said to be up. And if the price is below the Kumo, the prevailing trend is said to be down. A final feature of the Ichimoku chart is the PURPLE line, or Chikou Span (or Lagging Span). This line can be used to determine the strength of the buy or sell signal. If the Chikou Span is below the closing price for 26 periods ago and a sell signal is issued, then the strength is with sellers, otherwise it is a weak sell signal. Conversely, if there was a buy signal and the Chikou Span is above the price for 26 periods ago, then there is strength to the upside, otherwise, it can be considered a weak buy signal. This feature can also be incorporated into the other signals. */ SL = ( HHV( H, 26 ) + LLV( L, 26) )/2; TL = ( HHV( H, 9 ) + LLV( L, 9 ) )/2; DL = Ref( C, 25 ); Span1 = Ref( ( SL + TL )/2, -25 ); Span2 = Ref( (HHV( H, 52) + LLV(L, 52))/2, -25); MaxGraph = 6; Plot(SL,"SL",colorBlue,styleThick); // standard, base, or kijun-sen line Plot(TL,"TL",colorRed,styleThick); // turning, conversion, or tenkan-sen line Plot(DL,"DL",colorViolet,styleLine); // delayed, lagging, or chikou span Plot(Span1,"A",colorWhite,styleLine); // senkou span A, kumo, or white clouds Plot(Span2,"B",colorWhite,styleLine); // senkou span B, kumo, or white clouds Plot(Close,"Close",colorBlack,styleLine); // price close Buy1 = IIf(Cross(TL,SL) AND TL>Span1 AND TL>Span2,1,0); Buy2 = IIf(Cross(TL,SL) AND ( (TL>Span1 AND TL<Span2) OR (TL<Span1 AND TL>Span2) ),1,0); Buy3 = IIf( (Buy1 OR Buy2) AND C>Ref(DL,-26),1,0); Short1 = IIf(Cross(SL,TL) AND SL<Span1 AND SL<Span2,1,0); Short2 = IIf(Cross(SL,TL) AND ( (SL>Span1 AND SL<Span2) OR (SL<Span1 AND SL>Span2) ),1,0); Short3 = IIf( (Short1 OR Short2) AND C<Ref(DL,-26),1,0); IIf( (Buy1),PlotShapes(shapeDownArrow*Buy1,colorGreen),0); IIf( (Short1),PlotShapes(shapeUpArrow*Short1,colorRed),0); Bearbeitet 26. Juli 200916 Jr. von duncan Melden
Geschrieben 26. Juli 200916 Jr. comment_83699 Das ist so ziemlich unser alter Stand, mal sehen, ob ich das alte System auch noch finde ...Gruß Duncan Das alte System, mit ganz vielen Testzeilen ...[size="1"]/* ICHIMOKU CHART FOR DAY / WEEK Screen*/ //WERT=0.5; //CON1= Close > WERT AND MA( V * C * 100, 5 ) > 500000; CON1 = 1; //var def LONGSTOP = 0; ShortSTOP = 0; DSL = ( HHV( H, 26 ) + LLV( L, 26 ) ) / 2; DTL = ( HHV( H, 9 ) + LLV( L, 9 ) ) / 2; DSp1 = Ref( ( DSL + DTL ) / 2, -25 ); DSp2 = Ref( ( HHV( H, 52 ) + LLV( L, 52 ) ) / 2, -25 ); TimeFrameSet( inWeekly ); // switch to Weekly frame WSL = ( HHV( H, 26 ) + LLV( L, 26 ) ) / 2; WTL = ( HHV( H, 9 ) + LLV( L, 9 ) ) / 2; WSp1 = Ref( ( WSL + WTL ) / 2, -25 ); WSp2 = Ref( ( HHV( H, 52 ) + LLV( L, 52 ) ) / 2, -25 ); TimeFrameRestore(); // restore time frame to original WSP1e = TimeFrameExpand( WSP1, inWeekly ); WSP2e = TimeFrameExpand( WSP2, inWeekly ); MP = ( ( O + C ) / 2 ); Short_S1 = MP < WSp1e AND MP < WSp2e AND ( MP < DSP1 OR MP < DSP2 ); LONG_S1 = MP > WSp1e AND MP > WSp2e AND ( MP > DSP1 OR MP > DSP2 ); ROCL = IIf( ROC( Close, 200 ) > 0, 1, 0 ); ROCS = IIf( ROC( Close, 200 ) < 0, 1, 0 ); Color = IIf ( LONG_S1, colorGreen, IIf( Short_S1, colorRed, Graph1Color = 0 ) ); Color2 = IIf( ROCL, colorGreen, IIf( ROCS, colorRed, colorYellow ) ); /* plot color ribbon */ Plot( 1, "", Color, styleArea | styleOwnScale | styleNoLabel, -0.1, 50 ); Plot( 2, "", Color2, styleArea | styleOwnScale | styleNoLabel, -0.1, 50 ); Plot( C, "Price", Color, styleBar ); //_N(Title = StrFormat("{{NAME}} - {{INTERVAL}} {{DATE}} ")); PlotOHLC ( WSp1e, WSp1e, WSp2e, WSp2e, "Weekly", colorLightBlue, styleCloud ); PlotOHLC ( DSp1, DSp1, DSp2, DSp2, "Daily", colorGreen, styleCloud ); //digital Stochastic nach Philip Kahler periods = Param( "Periods", 5, 1, 200, 1 ); KAdjust = Param( "%K avg", 3, 1, 200, 1 ); DAdjust = Param( "%D avg", 3, 1, 200, 1 ); KAdjusted = StochK( periods, KAdjust ); DAdjusted = StochD( periods, KAdjust, DAdjust ); CON = ( ( 22 * KAdjusted ) + ( 8 * DAdjusted ) ) / 30; summ = IIf( CON > 50, 1, -1 ); DSS = Optimize( "digiStoch_Short", 0.5, 0.50, 1, 0.05 ); Short_S2 = IIf( Ref( EMA( Summ, periods ), -1 ) > DSS, 1, 0 ); //Plot( Summ, _DEFAULT_NAME(), ParamColor( "Color", colorCycle ), ParamStyle("Style") ); //Plot( EMA(Summ,periods), _DEFAULT_NAME(), ParamColor( "Color", colorCycle ), ParamStyle("Style") ); LONGSTOP = IIf( ( L > Ref( L, -1 ) AND Ref( L, -1 ) < Ref( L, -2 ) ), Ref( L, -2 ), IIf( LONGSTOP < Ref( L, -2 ), Ref( L, -2 ), LONGSTOP ) ); ShortSTOP = IIf( ( H > Ref( H, -1 ) AND Ref( H, -1 ) < Ref( H, -2 ) ), Ref( H, -2 ), IIf( ShortSTOP < Ref( H, -2 ), Ref( H, -2 ), ShortSTOP ) ); STOP = IIf ( LONG_S1, LONGSTOP, ShortSTOP ); //LONG DSL = Optimize( "digiStoch_Short2", -0.75, -1, 0, 0.05 ); Long_S2 = IIf( Ref( EMA( Summ, periods ), -1 ) < DSL, 1, 0 ); Buy = IIf( ( Long_S1 AND Long_S2 AND Ref( Summ, -1 ) < Summ )AND CON1, 1, 0 ); //Sell = IIf((Ref(Summ,-1) > Summ),1,0); //Sell=0; //P=Optimize("perst",18,1,20,1); Sell = IIf( Low < STOP, 1, 0 ); SellPrice = STOP; //Buy = ExRem( Buy, Sell ); //Sell = ExRem( Sell, Buy ); //PlotShapes( Buy * shapeUpArrow + Sell * shapeDownArrow, IIf( Buy, colorGreen, colorRed ) ); //SHORT Short = IIf( ( Short_S1 AND Short_S2 AND Ref( Summ, -1 ) > Summ )AND CON1, 1, 0 ); //RSIC=Optimize("RSIC",12,1,20,1); RSIC = 12; //Cover = IIf((Ref(Summ,-1) < Summ)OR RSI(3)<5,1,0); //Cover = IIf((Ref(Summ,-1) < Summ),1,0); DSS2=Optimize("digiStoch_Short2",-0.75,-1,0,0.05); Cover = IIf((Ref(EMA(Summ,periods),-1)< DSS2 AND Ref(EMA(Summ,periods),-1) < EMA(Summ,periods)) ,1,0); //Cover = IIf( High > STOP, 1, 0 ); //CoverPrice = STOP; //Short = ExRem( Short, Cover ); //Cover = ExRem( Cover, Short ); //Cover=0; //P=Optimize("ptstop",1,1,20,1); //X=Optimize("factor",2.7,0.1,3,0.1); //ApplyStop(stopTypeTrailing, stopModePoint, x*ATR(p), True, True ); //PlotShapes( Cover * shapeUpArrow + Short * shapeDownArrow, IIf( Cover, colorGreen, colorRed ) ); //BACKTEST SetTradeDelays( 1, 0, 1, 0 ); //Positionsgröße Size = 10;//% des verfügbaren Kapital bei 10.0000€ odr 10 % bei 100.000€ SetPositionSize( Size, spsPercentOfEquity ); // kaufe Shares für max. x %[/size]Gruß DuncanPS:blau ist die Wolke für den Wochenchart und grün für den Tageschart ... das sollte man sich nun auf Trendmärkte ansehen Forex, etc.andere Code basis[size="1"]/* ICHIMOKU CHART FOR DAY / WEEK Screen*/ //WERT=9; //CON1= Close > WERT AND MA( V * C * 100, 5 ) > 500000; CON1=1; DSL = ( HHV( H, 26 ) + LLV( L, 26 ) ) / 2; DTL = ( HHV( H, 9 ) + LLV( L, 9 ) ) / 2; DSp1 = Ref( ( DSL + DTL ) / 2, -25 ); DSp2 = Ref( ( HHV( H, 52 ) + LLV( L, 52 ) ) / 2, -25 ); TimeFrameSet( inWeekly ); // switch to Weekly frame WSL = ( HHV( H, 26 ) + LLV( L, 26 ) ) / 2; WTL = ( HHV( H, 9 ) + LLV( L, 9 ) ) / 2; WSp1 = Ref( ( WSL + WTL ) / 2, -25 ); WSp2 = Ref( ( HHV( H, 52 ) + LLV( L, 52 ) ) / 2, -25 ); TimeFrameRestore(); // restore time frame to original WSP1e = TimeFrameExpand( WSP1, inWeekly ); WSP2e = TimeFrameExpand( WSP2, inWeekly ); MP=(( O + C ) / 2); Short_S1 = MP < WSp1e AND MP < WSp2e AND (MP < DSP1 OR MP < DSP2); LONG_S1 = MP > WSp1e AND MP > WSp2e AND (MP > DSP1 OR MP > DSP2); Color = IIf ( LONG_S1, colorGreen, IIf( Short_S1, colorRed, Graph1Color = 0 ) ); /* plot color ribbon */ Plot( 1, "", Color, styleArea | styleOwnScale | styleNoLabel, -0.1, 50 ); Plot( C, "Price", Color, styleBar ); //_N(Title = StrFormat("{{NAME}} - {{INTERVAL}} {{DATE}} ")); PlotOHLC ( WSp1e, WSp1e, WSp2e, WSp2e, "Weekly", colorLightBlue, styleCloud ); PlotOHLC ( DSp1, DSp1, DSp2, DSp2, "Daily", colorGreen, styleCloud ); //digital Stochastic nach Philip Kahler periods = Param( "Periods", 5, 1, 200, 1 ); KAdjust = Param( "%K avg", 3, 1, 200, 1 ); DAdjust= Param( "%D avg", 3, 1, 200, 1 ); KAdjusted = StochK(periods,KAdjust); DAdjusted = StochD(periods,KAdjust,DAdjust); CON=((22*KAdjusted)+(8*DAdjusted))/30; summ=IIf(CON > 50,1,-1); //Plot( Summ, _DEFAULT_NAME(), ParamColor( "Color", colorCycle ), ParamStyle("Style") ); //Plot( EMA(Summ,periods), _DEFAULT_NAME(), ParamColor( "Color", colorCycle ), ParamStyle("Style") ); //LONG Buy = IIf((Long_S1 AND Ref(Summ,-1) < Summ)AND CON1,1,0); //Sell = IIf((Ref(Summ,-1) > Summ),1,0); Sell=0; P=Optimize("perst",18,1,20,1); ApplyStop(stopTypeTrailing, stopModePoint, 3*ATR(p), True, True ); //Buy = ExRem( Buy, Sell ); //Sell = ExRem( Sell, Buy ); PlotShapes(Buy * shapeUpArrow + Sell * shapeDownArrow, IIf( Buy, colorGreen, colorRed ) ); //SHORT Short = IIf((Short_S1 AND Ref(Summ,-1) > Summ)AND CON1,1,0); RSIC=Optimize("RSIC",12,1,20,1); //Cover = IIf((Ref(Summ,-1) < Summ)OR RSI(3)<5,1,0); Cover = IIf((Ref(Summ,-1) < Summ),1,0); Short = ExRem( Short, Cover ); Cover = ExRem( Cover, Short ); PlotShapes( Cover * shapeUpArrow + Short * shapeDownArrow, IIf( Cover, colorGreen, colorRed ) ); //BACKTEST //Positionsgröße Size = 25;//% des verfügbaren Kapital bei 10.0000€ odr 10 % bei 100.000€ SetPositionSize( Size, spsPercentOfEquity ); // kaufe Shares für max. 50 %[/size] Bearbeitet 26. Juli 200916 Jr. von duncan Melden
Geschrieben 27. Juli 200916 Jr. Autor comment_83710 Nicht ganz - wie bei jedem anderen Handelsstil ist auch hier nicht der Einstieg sondern der Ausstieg entscheidend (ist so ein Punkt, auf den wir in unserern Sendungen tagtäglich erneut hinweisen müssen). Dann endet das auch nicht tödlich. Jein,Es bringt aber doch meist Verluste.Halte ich den Stop zu eng, verpasse ich zu viele gute Trends,fahre ich einen weiten Stop gleichen die wenigen guten Trades das Minus nicht aus. Melden
Geschrieben 27. Juli 200916 Jr. Autor comment_83711 Hi,schau Dir das mal an: Amibroker Lib ist interessant wie dort DL definiert ist. Vielleicht sollten wir an dieser Stelle mal eine entsprechend Frage platzieren.Gruß DuncanPS: Und noch ein Code zum spielen ... Moin, Ich habe dort schon viel "Wunder Programme" gefunden.Deshalb habe ich dann aufgehört da was zu suchen,höchstens wenn ich mal einen Tip für eine Programmierung brauche schaue ich da noch rein.Kann jeder sein Programm einstellen ohne das Sie wirklich geprüft sind. Ansonsten sollten wir erst mal wieder einen Schritt zurück schalten und schauen was wir wollen. Ich halte Kahlers doppel Wolke für anders handelbar wie hier den Urspünglichen. Man sollte sich jetzt erst mal einigen was man will,Trendfolge, Ausbruch oder so und dann genau überlegen wann Einsteigen und wie Aussteigen. Sonst wissen wir hier nachher nicht mehr wer wo von spricht. Und Krümel hat mir ja verboten dich mit Programmierarbeit zu überfordern Muss jetzt dann mal Deine ganzen Sachen hier durch arbeiten. PS,Das ist so ziemlich unser alter Stand, mal sehen, ob ich das alte System auch noch finde ...Gruß Duncan Beim Digi sollten wir den Stoch vielleicht mal komplett selber berechnen. Welches alte System meinst du? Melden


Ich scheine mein Spielzeug für die nächsten Tage gefunden zu haben.
Habe jetzt noch nicht Kontrolliert in wie weit die Signale so wirklich handel bar sind.
Sollte aber eigentlich gehen da ich nach Signalgenerierung zum nächsten Open kaufe.
Getestet auf den Russel 1000
Start 01.01.2007
3% Kapital pro Trade
Backtest jetzt mit Margin Konto 1 zu 2
Ich lasse jetzt erst mal die Zahlen auf mich einwirken
bevor dann bei genauer Betrachtung das nicht machbare sichtbar wird

Morgen folgen dann die Einzelheiten