

ibelieve
Silent Reader
-
Benutzer seit
-
Letzter Besuch
Alle Inhalte von ibelieve
-
Ich stehe mit meinem Englisch irgend wie vor einer schwarzen Wand. Wenn einer so nett wäre mir die Definition des NR4-2 zu erklären, danke.
-
Zum merken wenn ich es mal testen sollte. Wo bei ich das NR4-2 noch nicht so ganz verstanden habe
-
Hat sich schon mal wer damit beschäftigt? Eigentlich ganz Simpel. http://www.traderji.com/advanced-trading-s...html#post323030 Just initiating this thread to discuss possible expansion setup 1) What is NR7 pattern (Narrow Range 7) ? Market goes thru regular contraction (i.e. daily trading range getting shorter and shorter) and expansion (i.e. daily trading range getting bigger) cycle. Expanding range is followed by Contraction and vice-versa. So if we can indetify the narrow range days, then it give us a step ahead of everybody to benefit from coming expansion. NR7 is term given to a day that has the daily range smallest of last 7 days including that day. NR4 is variation of this where the lookback period is 3 days + current day i.e. 4 days. E.g. - Date High Low Range Remark 27-May-09 4,286.45 4,115.25 171.20 28-May-09 4,354.85 4,254.85 100.00 29-May-09 4,488.05 4,340.75 147.30 1-Jun-09 4,545.40 4,450.40 95.00 NR 4 day. Range smallest of last 7 entries from 28/May till today i.e. 1-Jun ) 2-Jun-09 4,586.40 4,453.40 133.00 3-Jun-09 4,574.90 4,478.60 96.30 4-Jun-09 4,582.20 4,453.45 128.75 5-Jun-09 4,636.85 4,561.95 74.90 NR 7 day. Range smallest of last 7 entries from 28/May till today i.e. 5-Jun ) 8-Jun-09 4,611.40 4,404.65 206.75 Break of the low of 4561 of NR7 day took it to low of 4365 in next 2 days. Notice the range expansion (206+197 points). 9-Jun-09 4,562.45 4,365.10 197.35 As far as I know, this setup was discussed by Toby Crabel first. Later Linda Raschke has also discussed this in her book "The street smart". To know more about them you can either refer to these sources or raise questions here and I /other members here will try to clarify it. Happy Trading. How to Find NR7 day.. 1) Get the High and Low data of last few period 2) Calculate the range of each day i.e. high - low) for each day 3) Compare the range of a today and previous 6 days range (to get NR7. To get NR4 get last 3 days range) 4) If todays range is smallest of all 7 days, then today is NR7 day..else not. It is that simple. Suggested Trading System - DRAFT rules I am providing the rule for the system here. It is for purpose of backtesting. Based on the result, we might have to modify them. The text between < > is for explanation. Feel free raise your doubts, if any and I or others will try to clarify them. If there is any error / ambiguity then please highlight so that I can correct it (I am human being and do make errors regularly). Assumptions - 1) After today’s market close, we have the system in place to find out whether today was NR7 day or not (i.e. smallest range of last 7 trading days) You can use the excel sheet attached in post 2 of this thread. 2) We have the time to enter the orders during tomorrow market hours (not busy day at office etc) 3) It is SWING TRADING position i.e. we are looking to hold this position for more then 1 day. We will be using DAILY timeframe chart of NIFTY SPOT to take any trading decision. 4) We are going to use NIFTY FUTURES – NEAR MONTH to trade. On last week of the month, we will start using NEXT Months NF Contract. 5) Do we want to use FILTER of few points above High/Low or not ? 6) Designing the strategy to go SHORT first. This is to maintain simplicity. The rules can be adjusted for LONG entry by applying the same logic with minor adjustments.. Underlying logic behind why this strategy should work - Refer to post 1 of this thread.. <If you don’t believe in this underlying logic then it doesn’t make any sense for YOU to go ahead with strategy. Even if it is profitable, YOU will find it difficult to implement it because of many psychological challenges posed by your subconscious mind. So either get convinced by underlying logic by asking question, reading, research etc or move onto something else.> Setup Rules 1) NR7 setup is triggered today. 2) Note the HIGH and LOW of today. (Calling Day0-H and Day0-L) <these are basic condition that should be met. If they are not in place then skip any other action and do something else> Entry Rules1) SELL below the Day0-L on next day i.e. Day1. (BUY above the Day0-H) <These rules should be clear enough for even a 10yr old person with basic knowledge of chart construction, to understand else there is chance of improvement> Exit - Stoploss 1) For Short trades, stoploss is at the Day0-H. (For long trades, stoploss is at the Day0-L). <if using multiple contracts, then write in details how much of position will u liquidate and at what point> Exit - Profit taking 1) No plan to place profit taking order for the time being. Trailing stoploss orders will be used to exit the position. <you can define your rules for profit taking if you want. I generally touch this section after backtesting/some experience with the system> <if using multiple contracts, then write in details how much of position will u liquidate and at what point> Exit –Trailing Stoploss 1) For Short trade, trail with the stop at HIGH of Previous 2 bars. (i.e. On Day1, stop = Day0-H/ Day2 , stop = Day0-H/ Day3, stop = Day1-H / Day4, stop = Day2-H and so on) 2) If market gaps from trailing stop order level /or for some reason the trailing stoploss order is not executed, then close the position immediately at whatever price is available. 3) Stoploss moves only in the direction of the trade. They are never moved against the direction of our position. <if using multiple contracts, then adjust this section accordingly> Following two sections needs to be customised for individuals account size and risk tolerance limit. But the example below will guide u in answering them. I will certainly like to come back and update these sections as they are the foundation of trader's long term survival and the success. Position size <this deal with the question - how much quantity? Best practice is not to put more then 5% of your acct capital on one single trade.> 1) Trade size - 1 NIFTY contract 2) No add-on is considered at this stage. <else write down how will u add-on to the position> Money Management 1) Initial risk of < 150 NIFTY points 2) Once in a trade, not to leave more then 200 points on the table. <This might result in overriding your trailing stoploss section but it is important for you to be comfortable with your open profit and not fear about loosing the profit Best practice - not to Risk (difference between entry point and stoploss) more then 2% of your acct capital on one single trade. If the risk in more then this then either skip the trade or accept the fact that you are taking higher risk and ready to face psychological roller-coaster ride when trade is open> Following two section are not specific to this strategy but they are basic for successful trading Mental /Psychological setup 1) Clarity in the underlying concept of this strategy. Know your strategy as much as possible.) 2) Not to confuse your mind with other exit rules.. that are not being backtested. 3) Focus on EXECUTING the trade RIGHT, not on result. YOU can only control your EXECUTION, it is upto market (which is beyond your control) to give u profit or loss. When not to trade this strategy - 1) When u are not comfortable with the market conditions <this section is one of the most important section for professional traders. They know the environment when this strategy will not work or produce poor result. You may not know at the beginning but as you backtest or start using this strategy, you will learn it gradually and can fill this section later.>
-
Bin mich noch am sortieren, aber so viel neues und Interessantes, da brauch ich einfach meinen Zeit.
-
Nur mal so, Ich finde den bisherigen Verlauf etwas unübersichtlich, von daher würde ich vorschlagen Ihr wählt einen "Häuptling"(sollte ein Arbeitstier sein was die anderen auch ab und an in den Hintern tritt) der eine Reihenfolge auf stellt was wann abgearbeitet wird und die geposteten Sachen zusammen fast. (oder fehlt nur mir der Faden so das ich nicht sehe wo Ihr jetzt dran seit, bzw. was Ihr schon alles habt?) Dann zu der Sache mit dem System was immer gewinnt. Halte ich nicht für so wichtig, wichtig ist das das System in schlechten Zeiten(also wo es nicht so gut für das System läuft) wenig Verlust macht. Am besten dadurch das es da dann gar nicht Investiert ist. Die Stellen muss ich nachher nur raus filtern und dann halt ein passendes System für die Zeit bauen. Ich sehe kein Problem darin 2-3 Systeme Parallel laufen zu haben. Vor allem nicht wenn Sie sich ergänzen und zu unterschiedlichen Zeiten(Markt Phasen) handeln. PS, Da ich die Sache eigentlich Interessant finde, aber nur Aktien EOD trade, die Frage ob es auch Leute gibt die Interesse hätten unter der voraus Setzung so was zu machen?
-
Wie kommst Du den darauf? Ich meinte das duzend anderer guter Leute hier. Ja werde ich dann mal so machen wie Du schriebst, oder aber erst ein mal liegen lassen und wenn ich mal wieder was in der Richtung suche schauen. Der Vorteil von Arbeit ist ja das Sie meist nicht weg läuft Edit, Angebote netter Frauen kann ich nie wieder stehen Edit2, auf dem Englischen Forum ist aber so viel neues das ich erst mal mit dem durch stöbern noch eine weile zu tun habe. Wenn ich jetzt ja noch lesen könnte was ich da sehe wäre es zwar noch schöner, aber so kann ich mich erst mal an dem ganzen AmiBroker Code begeistern.
-
Dann leg das Ding mal auseinander Ich hatte es ohne Beschreibung gefunden mit er Frage ob jemand schauen könnte warum es nicht läuft. Bei mir geht es aber. Aber Sinn und Zweck fehlt jetzt natürlich.
-
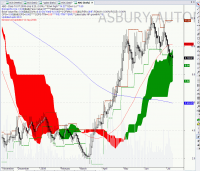
Lief mir grade über den Weg, habe mich auch noch nicht damit beschäftigt welche Logik dahinter steht. Aber in dem auf Trend wurde der Stop eigentlich sauber nach gezogen, oder nicht? _SECTION_BEGIN("3"); SetChartOptions(0,chartShowArrows|chartShowDates); TimeFrameSet(inDaily); //Plot(C,"close", colorBlack,styleCandle); Plot(MA(C,50),"50ema",colorRed,styleLine); Plot(MA(C,200),"200ema",colorBlue,styleLine); function ZeroLagTEMA( array, period ) { TMA1 = TEMA( array, period ); TMA2 = TEMA( TMA1, period ); Diff = TMA1 - TMA2; return TMA1 + Diff; } ///////////////////// // Heikin-Ashi code HaClose = (O+H+L+C)/4; HaOpen = AMA( Ref( HaClose, -1 ), 0.5 ); HaHigh = Max( H, Max( HaClose, HaOpen ) ); HaLow = Min( L, Min( HaClose, HaOpen ) ); // Velvoort is using not original, but modified Heikin-Ashi close HaClose = ( HaClose + HaOpen + HaHigh + HaLow )/4; // you can switch between Heikin-Ashi chart and regular candlestick chart if( ParamToggle("Plot Heikin-Ashi", "No,Yes", 1 ) ) PlotOHLC( HaOpen, HaHigh, HaLow, HaClose, "Heikin Ashi " + Name(), colorBlack, styleCandle ); else Plot( C, "Regular candles " + Name(), colorBlack, styleCandle ); period = Param("Avg. TEMA period", 55, 1, 100 ); ZLHa = ZeroLagTEMA( HaClose, period ); ZLTyp = ZeroLagTEMA( Avg, period ); //Plot( ZLHa, "ZLTema(Ha,"+period+")", colorRed ); //Plot( ZLTyp, "ZLTema(Typ,"+period+")", colorGreen ); Buy = Cross( ZLTyp, ZLHa ); Sell = Cross( ZLHa, ZLTyp ); //PlotShapes( shapeUpArrow * Buy, colorGreen, 0, HaLow ); //PlotShapes( shapeDownArrow * Sell, colorRed, 0, HaHigh ); _SECTION_BEGIN("Volume"); Plot( Volume, "Volume", ParamColor("Color", colorLavender ), styleNoTitle | ParamStyle( "Style", styleHistogram | styleOwnScale | styleThick | styleNoLabel, maskHistogram ), 2 ); _SECTION_END(); //Plot(MA(V,10),"10mav",colorRed,styleDots,styleOwnS cale); green = EncodeColor(colorBrightGreen); red = EncodeColor(colorRed); blue = EncodeColor(colorBlue); black = EncodeColor(colorBlack); violet = EncodeColor(colorViolet); skyblue=EncodeColor(colorSkyblue); white=EncodeColor(colorWhite); a=(GetFnData("SharesOut")); //share Capital in Crs. b=(GetFnData("ReturnOnAssets")); //FACE VALUE d=(GetFnData("InsiderHoldPercent")); //PROMOTERS STAKE % e=(a/b)*100000; //to get no of total shares by dividing share capital in crs by face value. //AddColumn(e,"Totalshares",1); f=(d*e)/100; //promotesr nos of shares from total num shares g=(e-f); //float i=(GetFnData("BookValuePerShare")); j=(GetFnData("DividendPerShare")); k=(GetFnData("LeveredFreeCashFlow")); m=(GetFnData("EPS")); n=(GetFnData("OperatingMargin")); p=(GetFnData("ProfitMargin")); q=(GetFnData("QtrlyEarningsGrowth")); r=(GetFnData("EPSEstCurrentYear")); r1=(j*b/100)*100/C; r2=(GetFnData("EPSEstCurrentYear")); r3=(GetFnData("ReturnonEquity")); r4=(GetFnData("ProfitMargin")); Filter=1; //Filter=q>25 AND (C/r)<10; AddColumn(C,"close",1.2); AddColumn(C-Ref(C,-1),"ch in Pr ",1.2); AddColumn((GetFnData("EPSEstCurrentYear")),"eps-TTM",1.2); AddColumn((C/GetFnData("EPSEstCurrentYear")),"PE-TTM",1.2); AddColumn(HHV(H,260),"52wHIGH" ); AddColumn(LLV(L,260),"52wLOW" ); AddTextColumn(FullName(),"name"); AddColumn((GetFnData("PROFITMARGIN")),"TTM np",1.2); AddColumn(p/a*i,"IV",1.2); //AddColumn((GetFnData("ReturnOnAssets")),"fv",1.0); //AddColumn((GetFnData("SharesOut")),"capital",1.2); AddColumn((GetFnData("BookValuePerShare")),"BV",1.2); //AddColumn((GetFnData("DividendPerShare")),"DIV%",1.2); //AddColumn((GetFnData("LeveredFreeCashFlow")),"cps" ,1.2); //AddColumn((GetFnData("EPS")),"eps",1.2); //AddColumn((GetFnData("QtrlyRevenueGrowth")),"NP gowth LQ",1.2); //AddColumn((GetFnData("SalesPerShare")),"sales/sh"); AddColumn((GetFnData("OperatingMargin")),"OPM",1.2 ); //AddColumn((GetFnData("ProfitMargin")),"NP",1.2); AddColumn((GetFnData("QtrlyEarningsGrowth")),"eps growth-ttm",1.2); Title = StrFormat("{{NAME}} - {{INTERVAL}} {{DATE}} cmp %g, (%.1f%%) ", C, SelectedValue( ROC( C, 1 ) ) )+black+"**52wk high**"+blue+WriteVal(HHV(H,260),1.2)+black+"**52w k Lo**"+blue+WriteVal(LLV(L,260),1.2) +"\n"+"EqCap.Rs Crs.= "+blue+WriteVal(a,format=1.2)+Black+"[&&&]"+" Face Value="+blue+WriteVal(b,format=1.0)+black+"[*****]"+" Mktcap(Crs)= "+blue+WriteVal(a*C/b,format=1.0)+Black+"\n" +"Book Value Rs= "+blue+WriteVal(i,format=1.2)+Black+"[&&&]"+" Div%="+blue+WriteVal(j,format=1.2)+" Div Yield % "+WriteVal(r1,format=1.2)+black+"[***]"+" OPM%= "+Red+WriteVal(n,format=1.2)+Black+"[&&]"+" P/BV="+blue+WriteVal(C/i,1.2)+black+" RONW= "+WriteVal(r3,format=1.2)+"%"+" ROCE= "+WriteVal(r4,format=1.2)+"%"+"\n" +"CPS= "+blue+ WriteVal(k,format=1.2)+Black+"[&&&]"+ " EPS="+blue+WriteVal(m,format=1.2)+black+"[*****]"+ " EPS-TTM="+Red+WriteVal(r,format=1.2)+blue+ "****P/E-TTM***"+blue+WriteVal(C/r,1.2)+ Black+"**Latest qtrly NP growth%**"+blue+WriteVal(q,1.0)+ "\n"+"Updated upto Qtr " +GetFnData("SHARESSHORT") +"\n"+red+"fundas last updated 14 Aug 2008"; /*The following builds Fractal Up*/ var1=ValueWhen( (Ref(H,-2) > Ref(H, -4)) AND (Ref(H,-2) > Ref(H, -3)) AND (Ref(H,-2) > Ref(H, -1)) AND (Ref(H,-2) > H), Ref(H,-2),1); FractalUp=HighestSince(var1>0,var1,1); Plot(FractalUp,"Res",colorBrown,8); /*The following builds Fractal Down*/ var2= (Ref(L,-2) <= Ref(L, -1)) AND (Ref(L,-2) <= Ref(L, 0)) AND (Ref(L,-2) <= Ref(L, -3)) AND (Ref(L,-2) <= Ref(L, -4)); FractalDown=ValueWhen( var2,Ref(L,-2),1); Plot(FractalDown,"Supp",colorGreen,8); SL = ( HHV( H, 26 ) + LLV( L, 26) )/2; TL = ( HHV( H, 9 ) + LLV( L, 9 ) )/2; DL = Ref( C, 25 ); Span1 = Ref( ( SL + TL )/2, -25 ); Span2 = Ref( (HHV( H, 52) + LLV(L, 52))/2, -25); PlotOHLC( 0, span1, span2, span2, "Cloud", IIf(span1>span2,colorGreen,colorRed), styleCloud ); GfxSetOverlayMode(1); GfxSelectFont("Tahoma", Status("pxheight")/15 ); GfxSetTextAlign( 8 );// center alignment GfxSetTextColor( ColorRGB( 200, 200, 200 ) ); GfxSetBkMode(1); // transparent GfxTextOut( FullName(), Status("pxwidth")/2, Status("pxheight")/8 );
-
Deswegen ziehe ich im Moment Systeme mit festen TP auch Trend folgenden Systemen vor. Ansonsten halte ich mich jetzt hier was zurück, wahrscheinlich geht Ihr eh auf einen markt den ich nicht handele und auch auf ein Zeitfenster was für mich zeitlich nicht in Frage kommt da ich nur Aktien EOD handele.
-
Ich will ja nicht nerven, aber irgend wie gibt es hier Sache wo wir wohl komplett aneinander vorbei reden Damit mache ich aber nie ein Trend folgendes System. Ihr wollt ein System was in Trend Märkten und in Trend losen Zeiten geht, aber eigentlich durch den festen TP nie Trend folgend arbeitet? Ihr wollt bei einem langen Trend lieber mehrmals ein und aussteigen anstatt den ganzen Trend auf ein mal mit nehmen? Heist ich muss in Trend Märkten Hoch Tief Punkte erkenne und handele nur die Haupttrend Richtung? Heist ich muss in Seitwärts Märkten die obere und untere Begrenzung erkennen und handele beide Richtungen?
-
Ich gehe so gar so weit und behaupte die Trend folge hat sehr wenig mit dem Einstiegssignal zu tun sondern der Stop entscheidet ob ich Trend folgend handele oder nicht.
-
Hat das Kind einen Namen? Ich verstehe es nicht ganz und würde dann mal nach Googeln
-
Nööö, ein Trend-Trader macht viele kleine Verluste(wenn er sich an sein System hält, sonst macht er halt große Verluste) und hofft auf ein paar gute und lange Trends um seinen Gewinn ein zu fahren. Sein C/R Verhältnis, wenn er es den berechnet(eigentlich kann er es nicht da er im voraus kein Ziel hat, also geht es nur über eine Schnitt Berechnung der abgeschlossenen Trades) sollte immer hoch liegen um auch bei 30% TQ zu über leben. Handele ich Formationen mit festen Zielen kann ich auch mit einem C/R Verhältnis kleiner 1 überleben wenn ich den auf eine hohe TQ durch mein System komme. ansonsten ist es eigentlich so das ich nur auf eine hohe Gewinnwahrscheinlichkeit komme wenn ich meinen Zielbereich nach unten an passe.
-
Die Regierung hat uns aber jetzt alle wieder reich gerechnet. Sie behaupten zu mindest das es ab morgen wieder aufwärts geht. http://wirtschaft.t-online.de/c/19/40/17/24/19401724.html
-
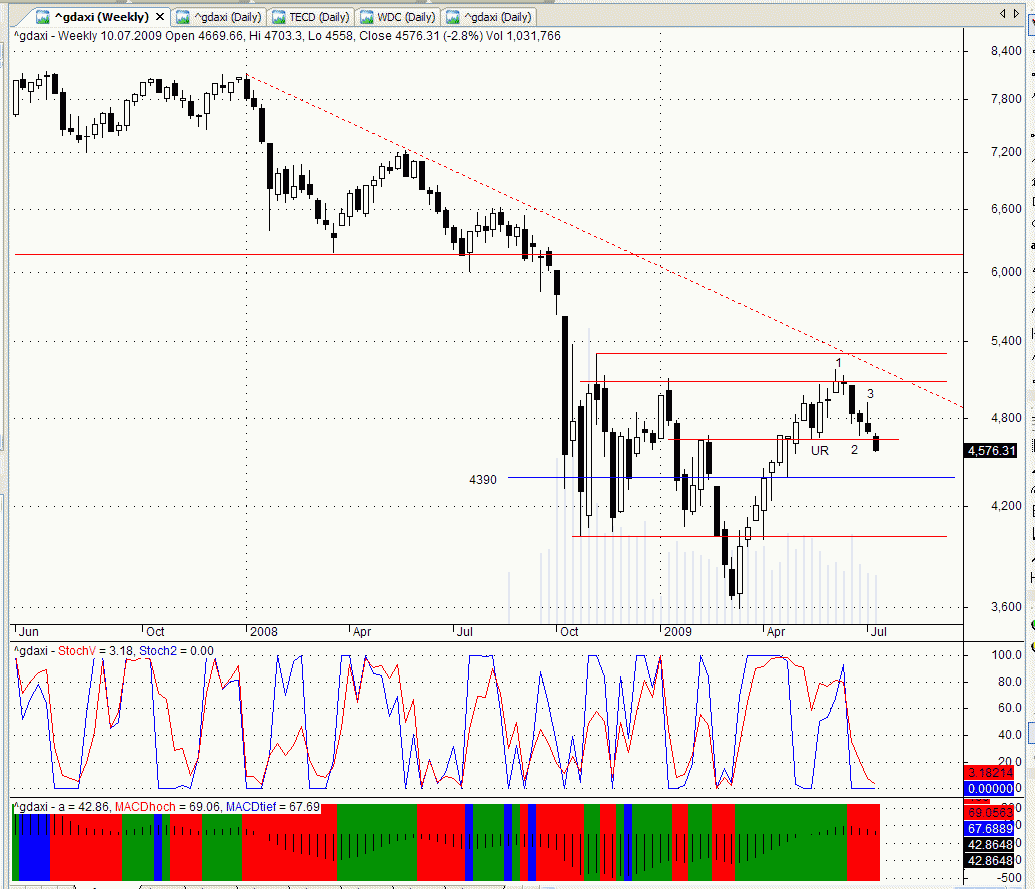
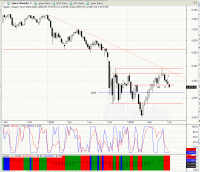
Einer muss ja hier was zur Unterhaltung der Anderen leisten Der Wochenchart, Wir hatten ein 123 Hoch wo jetzt der Punkt 2 durchhandelt wurde und gleichzeitig wurde ein Umkehr Ross Haken (ein Punkt 3 aus der Aufwärtsbewegung) unter boten. Von daher gehe ich von einer Fortsetzung aus. Im Tageschart, muss jetzt der RH bei 4558 genommen werden. Dann Interessieren die nächsten Bars erst mal nicht. Und am Ende landen wir dann bei meinem schwarzen Strich der bei 4486,45 Punkten steht. PS, sollte es anders kommen werde ich am ende der Woche behaupten das ich zu dem Zeitpunkt dieser niederschrift besoffen war und alles ganz anders meinte
-
Wenn Du Null und Unendlich meist stimme ich Dir zu
-
Mal schauen ob sich was draus machen lässt. http://www.traderji.com/amibroker/30596-1-...html#post333536 http://www.traderji.com/attachments/amibro...ab92bc2ecee.pdf //1-2-3 High OR Low from metastock // link http://www.meta-formula.com/Metastock-Formulas-A.html //http://www.tradejuice.com/forex/forex-1-2-3-methode-mm.htm //-------------------------- // Uptrend 8 conditions defined AND This works best as a reversal pattern //1) identify a previous downtrend. )Wait for the MACD to Signal a Buy AND //3)for the 1-2-3 LONG set up to be in place. //4)As the market pulls back to point 3, the MACD should remain in //Buy mode OR just slightly dip into Sell. //5)Place a Buy entry order 1 tick above point 2 //6)Place a stop loss order 1 tick below point 3 //7)Measure the distance between point 2 AND 3 AND project that //forward for your exit. //8)Point 2, should NOT be lower than point 1 for 1-2-3 longsetup. //------------------------------------- //1-2-3 SHORTSETUP //Downtrend 8 CONDITIONS to be met. //1) Identify a previous UPtrend. 2)Wait for the MACD to Signal a Sell AND //3)for the 1-2-3 SHORTset up to be in place. //4)As the market pulls back UP to point 3, the MACD should remain in //Sell mode OR just slightly dip into Buy. //5)Place a Sell entry order 1 tick BELOW point 2 //6)Place a stop loss order 1 tick ABOVE point 3 //7)Measure the distance between point 2 AND 3 AND project that //forward DOWN for your exit. //8)Point 2, should NOT be HIGHER than point 1 for 1-2-3 SHORTsetup. //-------------------------- S3 = C; s4=TimeNum(); radius = 0.45 * Status("pxheight"); textoffset = 2.2 * radius; GfxSelectFont("Tahoma", 12 ); GfxSetTextColor( colorBlue ); GfxTextOut(Date() ,textoffset +80,5 ); GfxSetTextColor( colorBlue ); GfxTextOut( "1 2 3 macd Close =" + s3, textoffset + 100, 30 ); GfxTextOut( "ADX(10) " + ADX(10), textoffset + 130, 70 ); GfxTextOut( "MACD() " + MACD(), textoffset + 130, 50 ); SetChartBkColor(50);//LIGHT YELLOW //1-2-3 High OR Low //Low Mxl=MA(L,4); xx=L > Ref(L,-1) AND L>Mxl AND Ref(L,-1) < Ref(Mxl,-1) AND LLV(L,5 ) > LLV(L,10 ) AND MACD()<0; //High Mxh=MA(H,4); yy=H < Ref(H,-1) AND H < Mxh AND Ref(H,-1) > Ref(Mxh,-1) AND HHV(H,5 ) < HHV(H,10) AND MACD()>0; PlotShapes( shapeUpTriangle*xx, colorBlue, 0, L , -10 ); PlotShapes( shapeDownTriangle*yy, colorRed, 0, H, -10 ); Plot(C,"",47,64);

-
Ich hoffe ich bekomme keinen ärger wenn ich hier andere Forums poste. Ist aber das erste wo unter den Rubriken Software AmiBroker die meisten Einträge hat. Zwar nicht ganz meinen Sprache (wenn ich nicht irre ein Forum aus Indien) (Muss ich sie nur noch zu meiner Sprache bringen ) aber vielleicht läuft ja einem was Interessante über den weg. Man muss aber wohl für die meisten Bereiche angemeldet sein. http://www.traderji.com/ Für Metastock Anwender vielleicht ein Interessanter Link (falls noch nicht bekannt) http://www.meta-formula.com/Metastock-Formulas-A.html oder zumindest zum Ideen holen. Muss ich mir als erstes mal die 123 oder Ross Haken anschauen.

-
Ich schliesse mich an Wann und wo sollen wir hin kommen?
-
Im Moment gibt es wenige Werte mit stabilen Trends. Die meisten Ausbrüche sind Fehlausbrüche um Stopps zu fischen. Ja, die Einstellungen sind noch ein Problem. Es fehlt immer noch das Menschliche Auge Dito. Neue Ideen braucht das Land PS, @Krümel eigentlich warst Du nicht schneller mit dem Antworten. Musste nur mal nee Stunde unterbrechen weil die Arbeit rief
-
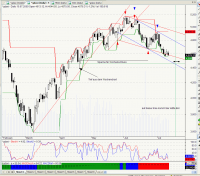
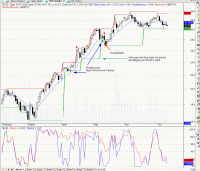
Dann müsste ich ja mal eine Sache zu ende denken. Also nein. Im Moment würde ich keine Ausbrüche handeln. Der Stochastic soll nur Anzeigen ob eine Bewegung abgeschlossen sein könnte. Ich gehe jetzt einfach mal davon aus das er für eine volle Korrektur die 50 Linie kreuzen muss. Wir hatten ein neues Kurs Hoch, der Stochastic ist bei 100. Dann warte ich bis der Stochastic unter 50 ist bevor ich nach einem lokalen Tief schaue. Gültigkeit hat das Lokale Tief so bald der Stochastic wieder über 50 ist. ??? "False-Singale" ich dummer Bauer. ??? Ein einfaches 123 kann jeder Blinde handeln, wenn er den immer auf die Bestätigung von Punkt 2 wartet. Ich will aber Punkt 3 vorweg nehmen, bzw. auch bestätigt haben wenn es gar nicht mehr zum überlaufen von Punkt 2 kommt. Dann habe ich nämlich nicht die Probleme mit einem Stop der sehr weit weg ist, bzw. verpasse eine Trendumkehr. Auf meinem Bild siehst Du vielleicht was ich meine. Der Einstieg war nach dem High Performance Trading, also einem Umkehrstab. Der erste Einstieg lief auch Perfekt. Der Stop war eng und mein Risiko gering. Beim 2ten Einstieg wurde ich gleich wieder Ausgestoppt. Hätte ich hier mit dem Stop nach ziehen gewartet bis zum neuen Hoch, was ja auch kam weil ich ja eigentlich zu unrecht ausgestoppt wurde wäre ich besser gefahren. Hätte dafür aber ein sehr schlechtes C/R Verhältnis am Anfang gehabt. Und ich hätte wahrscheinlich auch ohne die "Hilfe" den stop dahin gesetzt weil ich bei Bruch des Tiefs von einer fortsetzung der Korrektur ausgegangen wäre. Wie weit sie geht oder ob es wirklich eine Trendwende wird weiss man ja leider im voraus nie.
-
Wer lang genug bärisch ist, hat aber beim wechsel dann wenigstens noch was, was er anlegen kann
-
Wann ist den Schluss? 18:00 Uhr?
-
Wie wäre es mit dem jetzigen Kurs? oder noch 2 Minuten warten das er die 4605 genau trift
-
Um meinem Ruf gerecht zu werden Ist das wirklich so erstrebenswert? Ps, wir können uns ja auf den eröffnungs Kurs einigen