

joshsmi
Addict
-
Benutzer seit
-
Letzter Besuch
Alle Inhalte von joshsmi
-
Nee, bei meiner Version existiert nur der Instrument Manager. 6.5.1000.15 http://img181.imageshack.us/img181/5345/13524140.png Aber bevor ich eine andere neuere (?) 6.5 Version versuche, im Session Manager kann ich dann den time shift einstellen, ja? Im Instument Manager bei meiner Version habe ich unter "New" oder "Edit" jedenfalls nichts gefunden.
-
Danke bstrader, aber fündig bin ich nicht geworden. SessionTemplateManager? Wo finde ich den? Ich habe die 6er Version, nicht 7er. Im Instrument Manager finde ich auch nichts ohne Brille. :)
-
Gibt's das in Ninjatrader wie es im AB möglich ist, dass man den Feed an unterschiedliche Zeitzonen anpassen kann, z.B. Euroraum Zeitzone für Dax nach EST Zeitzone (Ami Ostküste) transferieren durch Abziehen von Stunden von der derzeitgen MEZ Zeit. Ich habe nichts gefunden in den Einstellungen.
-
Oanda ist zwar kein ECN, aber auch kein traditioneller MM. IMO, die einzige Alternative zu Interactive Brokers für Privatleute. London Capital Group habe ich noch als Alternative gehört. Habe ich mir aber noch nicht genauer angeschaut. Dukascopy sollte doch ziemlich teuer sein. Oder hat sich da was geändert? Jedenfalls, in Sachen Money Management ist Oanda ideal, egal ob große oder kleine Tradingkonten. Positionen lassen sich ideal einstellen. Die Zinsen für's halten der Positionen sind auch mit die besten am Markt, auch besser als bei IAB. Handelsplatform reicht für mich aus, da ich nur kaufen und verkaufen benötige. Und sie ist auf jedem PC lauffähig. API ist kostenlos, wenn man pro Tag um die 6 lot Umsatz macht.
-
-
-
Kennt jemand gescheite Dienste diesbezüglich? Erfahrungen über Zuverlässigkeit?
-
Schaue mal in den Data Base settings und stelle die Miunten der Trading Hours Abteilung auf Start XX:00, filtering auf 24h, dann sollte es auch im Chart so sein. Bei mir beginnen M5 Candles bei XX:00 also zB die Candle von 00:00 - 00:05 ist bei mir die 00:00 Candle. In den Preferences habe ich unter "Intraday" Start Time of Interval eingestellt. Für den Rest fehlt mir die sonntägliche Konzentration. :)
-
http://www.amibroker.com/devlog/2010/10/08/amibroker-5-31-0-beta-released/
-
Kann die Software auch empfehlen. Läuft problemlos und ist super billigst einfach. Nur einmal wollte es nicht funktionieren, als ich einem Ami Kumpel unter die Arme greifen wollte. Er ist aber der totale PC Analphabet (auch nach eigenem Bekunden). Ist also schwer vorstellbar, dass es an Teamviewer lag. Er hat dann freiwillig das Handtuch geworfen und sich einen neuen PC gekauft, wo mehr Viren drauf Platz haben.
-
Ich habe ja Yahoo und Google zusätzlich genannt. Natürlich werden diese für Scalper nicht geeignet sein. ;-) Den letzten Absatz verstehe ich nicht ganz. Klar musst du kostenpflichtige Feeds bezahlen. Zenfire ist auch nicht kostenlos. Der Interactive Brokers Feed ist sicherlich der kostengünstigste. Die Frage nach den guten Feeds war eine spezifische Frage an Roti, wie der Name eines guten Feedanbieters lautet. Schnell und ohne (wenig) Fehlticks ist klar.
-
Das mit den Feeds verstehe ich nicht. Was verstehst du unter einem guten Feed? Du sprichst von CQG. Amibroker hat ein Plugin dafür. Für Esignal gibt's ein Plugin. Interactive Brokers, IqFeed und andere. Für die Kostenlos Fraktion gibt es Yahoo und Google sowie Metatrader als Lieferanten. Es gibt auch Anwendungen für AB, über welche man von Google oder Yahoo 1min Daten ziehen und automatisch einspeisen kann. Ausprobiert habe ich es nicht. Es lassen sich auch selber Plugins entwickeln, nur bin ich zu untalentiert dafür. Dass du beim Verkauf Umschreibegebühren bezahlen musstest, finde ich allerdngs blöd. Mich persönlich stört das nicht, da ich AB nicht verkaufen würde. Dafür ist es nicht schlecht genug.
-
Um bei Forex 4 Stellen nach dem Komma zu erhalten, müßt ihr im mittleren Teil zwei Mal von 1.2 auf 1.4 umändern. VolRatio = VolChartHeight / VolHigh ; Range = priceHigh - priceMin; Ratio = BarChartHeight / Range ; PriceLineLevel = Range / NumberPriceLevels; yHi=(((priceHigh - priceMin )* Ratio) - BarChartHeight) * -1 + y1 + DataMargin; GfxTextOut ( WriteVal (priceHigh, 1.4 ), x1 + BarChartWidth, yHi -8 ); GfxSelectPen ( colorLightGrey ); GfxMoveTo ( x1 , yHi ); GfxLineTo ( x1 + BarChartWidth -5 , yHi ); for ( z = 0 ; z < NumberPriceLevels- 1 ; z++ ) { PriceLevel = PriceLineLevel*z + priceMin; yHi=(((PriceLevel - priceMin )* Ratio) - BarChartHeight) * -1 + y1 + DataMargin; GfxTextOut ( WriteVal (PriceLevel, 1.4 ), x1 + BarChartWidth, yHi -8 ); GfxSelectPen ( colorLightGrey ); GfxMoveTo ( x1 , yHi ); GfxLineTo ( x1 + BarChartWidth -5 , yHi );
-
Ihr müßt dafür zuerst eine Watchlist mit Werten füllen. Diese Watchlist und Anderes könnt ihr dann in den Einstellungen des Gesamtblattes auswählen. Watchlist 0 ist default. AFL ist nicht von mir. Von welchem Autor auch immer, feine Sache. //FIle: Multi-Chart // //January 10, 2008 //From AB board // create a watchlist and select in parameters window - along with other settings // GFX Drawing Example function GetMonth( MonthNumber ) { switch (MonthNumber) { case 2 : result = "Feb"; break ; case 3 : result = "Mar"; break ; case 4 : result = "Apr"; break ; case 5 : result = "May"; break ; case 6 : result = "Jun"; break ; case 7 : result = "Jul"; break ; case 8 : result = "Aug"; break ; case 9 : result = "Sep"; break ; case 10 : result = "Oct"; break ; case 11 : result = "Nov"; break ; case 12 : result = "Dec"; break ; } return result; } GfxSetOverlayMode( 2 ); String = "" ; for ( x = 0 ; x < 200 ; x++ ) { WList = CategoryGetName( categoryWatchlist, x ); if (WList != "" ) { String = String + WList +"," ; } } WatchList = ParamList ( "Watch List", String ); for ( x = 0 ; x < 200 ; x++ ) { sym = StrExtract ( String, x ); if (sym == WatchList) { listNum = x ; } } Page = Param ( "Page #", 0 , 0 , 12 , 1 ); ChartsWiNum = Param ( "# Charts Wide", 3 , 1 , 4 , 1 ); ChartsHiNum = Param ( "# Charts High", 3 , 1 , 4 , 1 ); Bars =Param ( "Number Of Bars", 195 , 50 , 250 , 1 ) ; lDays =Param ( "Long MA", 200 , 50 , 250 , 1 ) ; sDays =Param ( "Short MA", 50 , 5 , 100 , 1 ) ; vDays =Param ( "Volume MA", 50 , 5 , 100 , 1 ) ; ChartMargin = 5 ; DateMargin = 10 ; DataMargin = 20 ; NumCharts = ChartsWiNum * ChartsHiNum ; ScreenHeight = Status ( "pxheight" ) ; SceernWidth = Status ( "pxwidth" ) ; ChartHeight = ScreenHeight / ChartsHiNum -2 ; Width = SceernWidth / ChartsWiNum - 2 ; BarChartHeight= (0.75 ) * ChartHeight - DataMargin; VolChartHeight = ChartHeight - BarChartHeight - DataMargin*2 ; NumberPriceLevels = BarChartHeight / 25 ; BarChartWidth= Width - 45 ; BarWidth = (BarChartWidth - ChartMargin * 3 ) / Bars ; LastBar = BarCount ; FirstBar = LastBar - Bars; _N (list = CategoryGetSymbols( categoryWatchlist, listnum )); printf ( "Watch List Name\n"); WL = CategoryGetName( categoryWatchlist, listnum ); SymbolNum = Page * NumCharts; for ( x = 0 ; x < ChartsHiNum ; x++ ) { for ( i = 0 ; i < ChartsWiNum ; i++ ) { notDone = True; sym = StrExtract ( list, SymbolNum ); if (sym != "" ) { x1 = Width * i + 5 ; y1 = ChartHeight * x + 5 ; x2 = Width * (i + 1 ); y2 = ChartHeight * (x + 1 )-DateMargin; GfxSelectPen ( colorBlack ); GfxRectangle ( x1, y1, x2, y2 ); SymbolNum++; SetForeign (sym); EMAShort= EMA (C,sDays); EMALong= EMA (C,lDays); EMAVol= EMA (V,vDays); D = Day (); M = Month (); Y = Year (); priceHigh = 0 ; VolHigh = 0 ; priceMin = 1000000 ; for ( z = FirstBar; z < LastBar ; z++ ) { Vol = V[z]; BarH = H[z]; BarL = L[z]; if ( Vol > VolHigh ) { VolHigh = Vol; } if ( BarH > priceHigh ) { priceHigh = BarH; } if ( BarL < priceMin ) { priceMin = BarL; } } LOpen = O[LastBar- 1]; LHigh = H[LastBar- 1]; LLow = L[LastBar- 1]; LClose = C[LastBar- 1]; LVol = V[LastBar- 1]; GfxSelectFont ( "Tahoma" , 8 ); GfxSetTextColor (colorBlack); GfxTextOut (sym + " O: " +LOpen + " H: " +LHigh + " L: " +LLow + " C: " +LClose + " Vol: " +LVol/ 1000000 + " M", x1+5 , y1+2 ); VolRatio = VolChartHeight / VolHigh ; Range = priceHigh - priceMin; Ratio = BarChartHeight / Range ; PriceLineLevel = Range / NumberPriceLevels; yHi=(((priceHigh - priceMin )* Ratio) - BarChartHeight) * -1 + y1 + DataMargin; GfxTextOut ( WriteVal (priceHigh, 1.2 ), x1 + BarChartWidth, yHi -8 ); GfxSelectPen ( colorLightGrey ); GfxMoveTo ( x1 , yHi ); GfxLineTo ( x1 + BarChartWidth -5 , yHi ); for ( z = 0 ; z < NumberPriceLevels- 1 ; z++ ) { PriceLevel = PriceLineLevel*z + priceMin; yHi=(((PriceLevel - priceMin )* Ratio) - BarChartHeight) * -1 + y1 + DataMargin; GfxTextOut ( WriteVal (PriceLevel, 1.2 ), x1 + BarChartWidth, yHi -8 ); GfxSelectPen ( colorLightGrey ); GfxMoveTo ( x1 , yHi ); GfxLineTo ( x1 + BarChartWidth -5 , yHi ); } HighestLast = 0 ; w = 1 ; sEMAlast = EMAShort[FirstBar]; lEMAlast = EMALong[FirstBar]; vEMAlast = EMAVol[FirstBar]; for ( z = FirstBar; z < LastBar ; z++ ) { BarH = H[z]; BarL = L[z]; BarO = O[z]; BarC = C[z]; Vol = V[z]; sEMA = EMAShort[z]; lEMA = EMALong[z]; vEMA = EMAVol[z]; BarDay = D[z]; BarMonth = M[z]; BarYear = Y[z]; yO = (((BarO - priceMin )* Ratio)- BarChartHeight ) * -1 + y1 + DataMargin; yC = (((BarC - priceMin )* Ratio)- BarChartHeight ) * -1 + y1 + DataMargin; yHi = (((BarH - priceMin )* Ratio)- BarChartHeight ) * -1 + y1 + DataMargin; yLo = (((BarL - priceMin )* Ratio) - BarChartHeight) * -1 + y1 + DataMargin ; ysEMAlast = (((sEMAlast - priceMin )* Ratio) - BarChartHeight) * -1 + y1 + DataMargin; ysEMA = (((sEMA - priceMin )* Ratio) - BarChartHeight) * -1 + y1 + DataMargin; ylEMAlast = (((lEMAlast - priceMin )* Ratio) - BarChartHeight) * -1 + y1 + DataMargin; ylEMA = (((lEMA - priceMin )* Ratio) - BarChartHeight) * -1 + y1 + DataMargin; vHi = y2 - (Vol * VolRatio) ; yvEMAlast = y2 - (vEMAlast * VolRatio) ; yvEMA = y2 - (vEMA * VolRatio) ; if ( BarH > HighestLast ) { HighestLast = BarH; GfxSelectPen ( colorBlue ); } else { GfxSelectPen ( colorRed ); } // Plot bar GfxMoveTo ( BarWidth * w + x1 + ChartMargin , yHi ); GfxLineTo ( BarWidth * w + x1 + ChartMargin, yLo ); GfxMoveTo ( BarWidth * w + x1 + ChartMargin -1 , yO ); GfxLineTo ( BarWidth * w + x1 + ChartMargin, yO ); GfxMoveTo ( BarWidth * w + x1 + ChartMargin +1 , yC ); GfxLineTo ( BarWidth * w + x1 + ChartMargin, yC ); if ( BarO > BarC) { GfxSelectPen ( colorRed ); } else { GfxSelectPen ( colorLime ); } // Plot Volume GfxMoveTo ( BarWidth * w + x1 + ChartMargin , vHi ); GfxLineTo ( BarWidth * w + x1 + ChartMargin, y2 ); // Plot Price and Volume EMAs GfxSelectPen ( colorLime ); GfxMoveTo ( BarWidth * (w -1 ) + x1 + ChartMargin , ysEMAlast ); GfxLineTo ( BarWidth * w + x1 + ChartMargin, ysEMA ); GfxSelectPen ( colorDarkRed ); GfxMoveTo ( BarWidth * (w -1 ) + x1 + ChartMargin , ylEMAlast ); GfxLineTo ( BarWidth * w + x1 + ChartMargin, ylEMA ); GfxSelectPen ( colorBlack ); GfxMoveTo ( BarWidth * (w -1 ) + x1 + ChartMargin , yvEMAlast ); GfxLineTo ( BarWidth * w + x1 + ChartMargin, yvEMA ); w++; sEMAlast = sEMA ; lEMAlast = lEMA ; vEMAlast = vEMA ; GfxSelectFont ( "Tahoma" , 7 ); GfxSelectPen ( colorLightGrey ); // Draw vertical month separator and X-axis labels if (BarDay== 1 & notDone ) { if (BarMonth == 1 ) myLabel =WriteVal (BarYear, 1.0 ); else myLabel =GetMonth(BarMonth); GfxTextOut (myLabel, BarWidth * w + x1 + ChartMargin - 5 , y2 +DateMargin/3 ); GfxMoveTo ( BarWidth * w + x1 + ChartMargin , y2 ); GfxLineTo ( BarWidth * w + x1 + ChartMargin, y1 + DataMargin ); notDone = False; } if (BarDay== 2 & notDone ) { if (BarMonth == 1 ) myLabel =WriteVal (BarYear, 1.0 ); else myLabel =GetMonth(BarMonth); GfxTextOut (myLabel, BarWidth * w + x1 + ChartMargin - 5 , y2 +DateMargin/3 ); GfxMoveTo ( BarWidth * w + x1 + ChartMargin , y2 ); GfxLineTo ( BarWidth * w + x1 + ChartMargin, y1 + DataMargin ); notDone = False; } if (BarDay== 3 & notDone ) { if (BarMonth == 1 ) myLabel =WriteVal (BarYear, 1.0 ); else myLabel =GetMonth(BarMonth); GfxTextOut (myLabel, BarWidth * w + x1 + ChartMargin - 5 , y2 +DateMargin/3 ); GfxMoveTo ( BarWidth * w + x1 + ChartMargin , y2 ); GfxLineTo ( BarWidth * w + x1 + ChartMargin, y1 + DataMargin ); notDone = False; } if (BarDay== 4 & notDone ) { if (BarMonth == 1 ) myLabel =WriteVal (BarYear, 1.0 ); else myLabel =GetMonth(BarMonth); GfxTextOut (myLabel, BarWidth * w + x1 + ChartMargin - 5 , y2 +DateMargin/3 ); GfxMoveTo ( BarWidth * w + x1 + ChartMargin , y2 ); GfxLineTo ( BarWidth * w + x1 + ChartMargin, y1 + DataMargin ); notDone = False; } if (BarDay== 5 & notDone ) { if (BarMonth == 1 ) myLabel =WriteVal (BarYear, 1.0 ); else myLabel =GetMonth(BarMonth); GfxTextOut (myLabel, BarWidth * w + x1 + ChartMargin - 5 , y2 +DateMargin/3 ); GfxMoveTo ( BarWidth * w + x1 + ChartMargin , y2 - VolChartHeight ); GfxLineTo ( BarWidth * w + x1 + ChartMargin, y1 + DataMargin ); notDone = False; } if (BarDay== 6 |BarDay== 7 |BarDay== 8 |BarDay== 9 |BarDay== 10 ) { notDone = True; } } RestorePriceArrays (); } } }

-
-
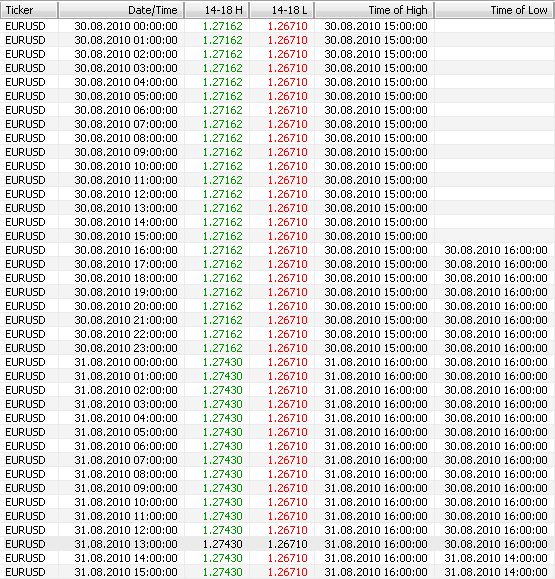
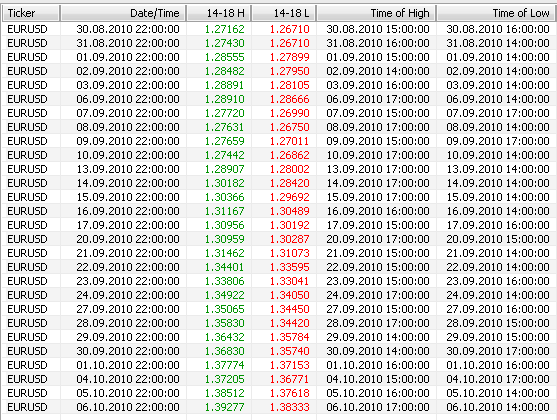
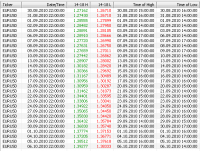
Hier zwei Bilder des Problems Einmal mit Filter = 1 und dann mit Timenum() == 220000 Weshalb 220000 und nicht 230000? Weil Freitage nur bis Stunde 220000 gehen, die würden sonst herausfallen. Filter = 1 ist das rechte Bild
-
Hi KB, das ist mir schon klar und habe ich auch probiert. Irgendwie klappt's nicht. Es kann sein, dass AB das von sich aus nicht zuläßt, nur die Zeit in der Exploration darzustellen. Bin aber nicht sicher. Oder ich bin einfach zu blöd. :D Wenn es jemand sicher wüßte, könnte man sich nämlich die Zeit sparen, da rumzustochern. Derweil habe ich das Problem der verschobenen TimeH und TimeL zur Hälfte lösen können. Es funktioniert aber nur mit TimeH. Fragt mich nicht wieso. Wenn ihr Filter auf 1; stellt, statt auf TimeNum() == 220000; dann seht ihr, was ich meine. Mit Filter TimeNum() == 220000 funktioniert es aber auch mit TimeL (obwohl es etwas von Pflaster draufkleben an sich hat). Aber es nervt mich trotzdem, nicht zu wissen, weshalb bei TimeL die Sache mit Compress und Expand nicht funktioniert. Vielleicht hat ja jemand eine Lösung. Nur gut, dass ich kein Profi Programmierer bin, der täglich mit solchen Rätseln zu tun hat. Ich glaube, ich würde durchdrehen. *Grins* PipValue= Param("PIP Value",0.0001,0.0001,0.01,0.01); Filter = TimeNum() == 220000; isRtH1 = TimeNum() >= 140000 AND TimeNum() < 180000; RH1 = IIf(isRth1, H, Null); RL1 = IIf(isRth1, L, 100000); DayH1 = TimeFrameCompress( RH1, inDaily, compressHigh ); DayH1 = TimeFrameExpand( DayH1, inDaily, expandFirst ); DayL1 = TimeFrameCompress( RL1, inDaily, compressLow ); DayL1 = TimeFrameExpand( DayL1, inDaily, expandFirst ); Days = Day(); LowestSoFar = LowestSince(Days != Ref(Days, -1), DayL1); HighestSoFar = HighestSince(Days != Ref(Days, -1), DayH1); DT = DateTime(); TimeH = TimeFrameCompress(ValueWhen( H == HighestSoFar , DT ), inDaily, compressHigh ); TimeH = TimeFrameExpand(TimeH, inDaily, expandFirst ); TimeL = ValueWhen(L == LowestSoFar, DT);//TimeFrameCompress(ValueWhen(L == LowestSoFar, DT), inDaily, compressLow ); //TimeL = TimeFrameExpand(TimeL, inDaily,expandFirst ); AddColumn(DayH1,"14-18 H",1.5,colorGreen,colorDefault,65); AddColumn(DayL1,"14-18 L",1.5,colorRed,colorDefault,65); AddColumn(TimeH, "Time of High", formatDateTime,colorDefault, colorDefault,120); AddColumn(TimeL, "Time of Low", formatDateTime,colorDefault, colorDefault,120);
-
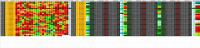
Ja, außer, das mir ein Engländer oder Ami einen Tipp für das Zeitproblem gab, habe ich den Rest allein erstellt. Aber wie man im Bild sieht, enthält es noch eine kleine Macke in der rechten Hälfte. Muss ich noch kucken, woran das liegt. Ich habe auch noch nicht kontrolliert ob die Werte alle passen bzw deren Bestimmung korrekt abgewickelt wird. Ist also noch Beta Status.
-
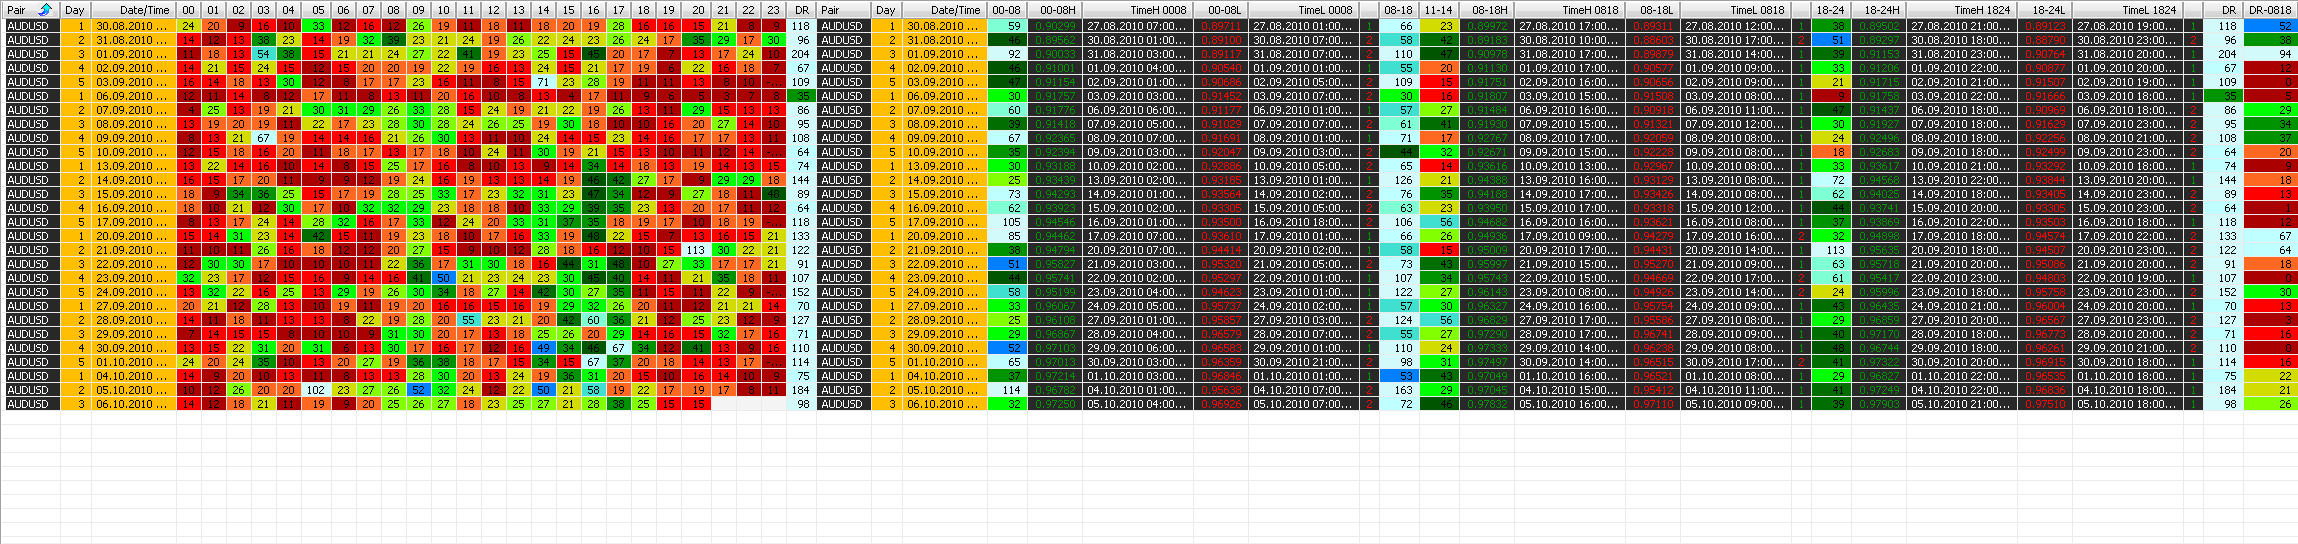
So könnte eine Beispielverwendung aussehen
-
Ronner, Zeit um zu Amibroker zu wechseln. Mit die beste Software am Markt. Ninja finde ich persönlich zu klobig, träge und unhandlich, mMn. Natürlich Pluspunkt ist, dass es kostenlos ist.
-
Ach ja das mit den Pfeilen in einer Exploration scheint nicht zu funktionieren. Dafür wird halt im Fall eines up arrows eine 1 und im Fall eines down arrows eine Zwei angezeigt. So what
-
Girls and boys, strip off your pants and clap your hands. I got it! Im Prinzip ganz einfach, nur wieder schwer gedacht. In den Settings des Auto Analysis Fensters am Besten auf Hourly stellen. Minute, ... etc dauert zu lang (beim Auswählen von "all quotations"), aber geht natürlich auch. Hier ein Beispiel AFL PipValue= Param("PIP Value",0.0001,0.0001,0.01,0.01); Filter = TimeNum() == 230000; isRtH1 = TimeNum() >= 140000 AND TimeNum() < 180000; RH1 = IIf(isRth1, H, Null); RL1 = IIf(isRth1, L, 100000); DayH1 = TimeFrameCompress( RH1, inDaily, compressHigh ); DayH1 = TimeFrameExpand( DayH1, inDaily, expandFirst ); DayL1 = TimeFrameCompress( RL1, inDaily, compressLow ); DayL1 = TimeFrameExpand( DayL1, inDaily, expandFirst ); Days = Day(); LowestSoFar = LowestSince(Days != Ref(Days, -1), DayL1); HighestSoFar = HighestSince(Days != Ref(Days, -1), DayH1); TimeH = ValueWhen(H == HighestSoFar, DateTime()); TimeL = ValueWhen(L == LowestSoFar, DateTime()); AddColumn(DayH1,"14-18 H",1.5,colorGreen,colorDefault,65); AddColumn(DayL1,"14-18 L",1.5,colorRed,colorDefault,65); AddColumn(TimeH, "Time of High", formatDateTime,colorDefault, colorDefault,120); AddColumn(TimeL, "Time of Low", formatDateTime,colorDefault, colorDefault,120); Das einzige Problem, das nervt, ist, dass nicht die Zeit allein angezeigt wird. Jemand ne Ahnung, wie ich das Datum in Time of High oder Time of Low wegbekomme? Bild

-
Hallo, ich wollte gern wissen, ob jemand weiß, ob es möglich ist in einer Exploration in einer Spalte Pfeile darzustellen. Wenn das und das so ist, dann up arrow und wenn das und das so ist, dann down arrow. Wie gesagt in einer Exploration nicht im Chart. Wenn ich z.B. shapeuparrow verwende wird nur eine 1 statt eines Pfeiles angezeigt. Desweiteren, wie kann ich den Zeitpunkt eines Kurses bestimmen, z.b. zu welcher Zeit wurde das Tageshoch oder- tief o.S. erreicht?
-
Habe es mir mal angesehen und es schaut nicht nach Oanda als Source aus.
-
Das sieht mir irgendwie verdächtig danach aus, als wären das Daten vom Oanda FXTicks Service. Was mich im Verdacht bestärkt, ist, dass der letzte Eintrag auch 2 Monate zurückliegt. Bei Oanda bekommt man diese Ticks auch nur bis maximal 2 Monate vom jetzigen Datum zurückgerechnet. Muss ich mir mal anschauen, ob das letzte Datum im Ordner August der 2te oder der 3te ist. Es steht ja auch nirgends woher die Daten sind. Nur GMT als Zeitzone und das ist bei FXticks auch der Fall. TrueFX hat als Kontaktland auch Kanada. Hmm... Werde weiter berichten. Falls es zutreffen sollte und Oanda weiß nichts davon, bewegen die sich schon auf dünnem Eis. Wer sich registieren will kann diesen Mail Service verwenden http://10minutemail.com